The Complete Guide to Customer Acquisition Cost (CAC)
Master CAC calculation, benchmarks, and optimization strategies. Learn how to calculate customer acquisition cost correctly and improve your LTV:CAC ratio.
Customer acquisition cost is the single most critical metric for understanding the efficiency of your SaaS business. Every dollar you spend to acquire a customer needs to return multiple dollars in lifetime value, or you're simply burning cash with no path to profitability.
Yet despite its importance, most companies miscalculate their CAC, leading to false confidence in unit economics that don't actually work. This guide will show you exactly how to calculate customer acquisition cost correctly, benchmark it against industry standards, and optimize it to build a sustainable growth engine.
What is Customer Acquisition Cost?
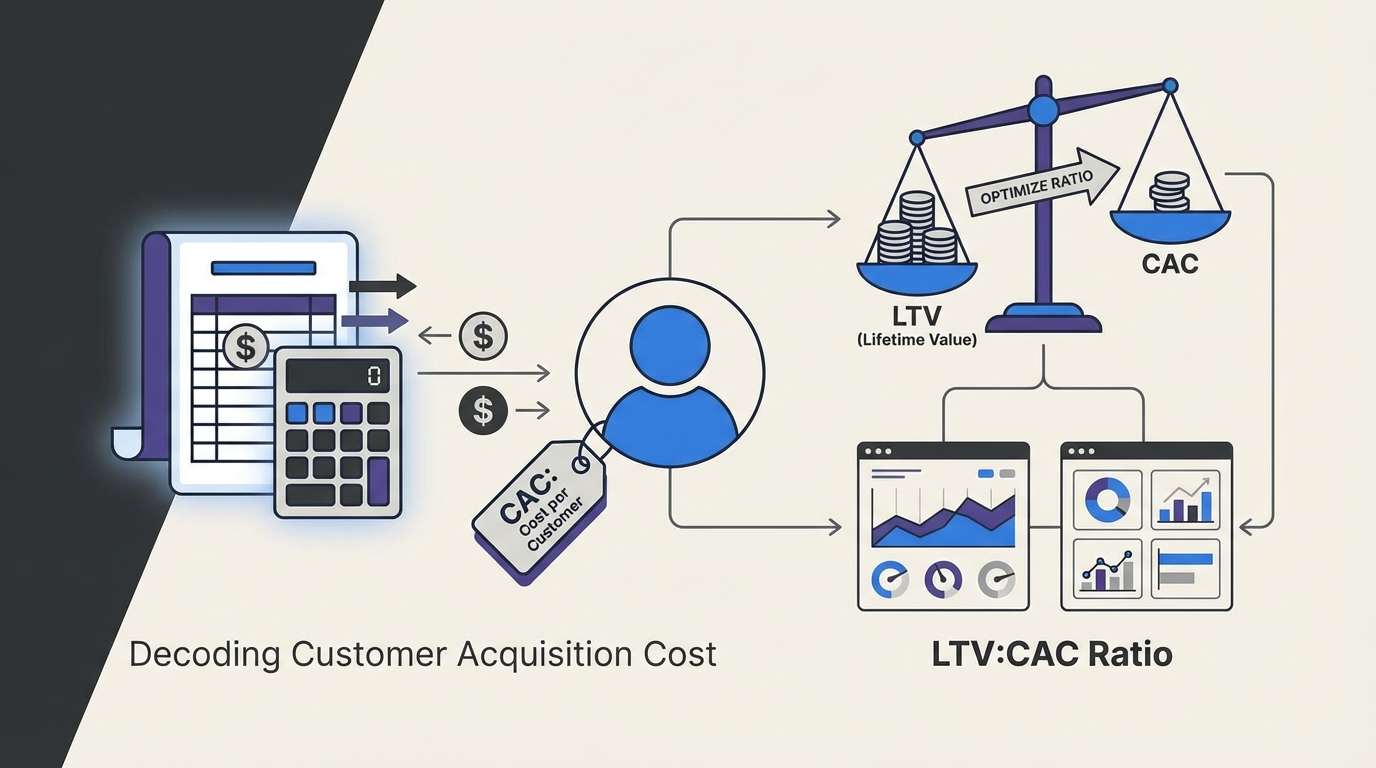
Customer acquisition cost (CAC) is the total amount of sales and marketing spend required to acquire a single new customer. It represents the full cost of converting a stranger into a paying customer, including everything from advertising costs to sales salaries.
For SaaS businesses specifically, CAC is foundational to understanding whether your business model is viable. If it costs you $10,000 to acquire a customer who will only ever pay you $5,000 in lifetime value, you have a business that destroys value with every sale. But if that same $10,000 customer acquisition cost leads to $50,000 in lifetime value, you've built a machine that prints money at a 5x return.
The relationship between CAC and customer lifetime value (LTV) determines whether you have a business worth scaling or one that will run out of cash before reaching profitability.
CAC vs Other Acquisition Metrics
CAC is often confused with related metrics, but each serves a different purpose:
| Metric | Definition | Use Case |
|---|---|---|
| Cost Per Lead (CPL) | Cost to acquire a lead who has expressed interest but hasn't purchased | Marketing efficiency metric |
| Cost Per Click (CPC) | What you pay for each click on an ad | Media buying metric |
| Cost Per Acquisition (CPA) | Sometimes used interchangeably with CAC, but can be ambiguous | Avoid - use CAC instead |
| Customer Acquisition Cost (CAC) | Fully-loaded cost to acquire a paying customer | Unit economics metric |
Customer Acquisition Cost (CAC) is the metric that matters for unit economics. It captures the fully-loaded cost to acquire a paying customer, including all marketing and sales expenses.
How to Calculate CAC: Multiple Methods
There are several ways to calculate CAC, each with different levels of precision and applicability to different business models.
Simple CAC Formula
The most straightforward calculation divides total sales and marketing expenses by the number of new customers acquired in that period:
CAC = (Total Sales + Marketing Spend) / New Customers AcquiredExample:
- Monthly marketing spend: $50,000
- Monthly sales team costs: $30,000
- New customers acquired: 20
CAC = ($50,000 + $30,000) / 20 = $4,000 per customerThis simple formula is useful for quick checks and high-level tracking, but it has limitations we'll address below.
Blended vs Fully-Loaded CAC
Blended CAC takes a simplified approach by dividing all sales and marketing spend by all new customers, regardless of which channel or team acquired them. This is the simple formula shown above.
Fully-Loaded CAC includes additional costs that contribute to customer acquisition:
Fully-Loaded CAC = (Sales + Marketing Spend + Salaries + Software +
                     Overhead + Commissions) / New Customers
What to Include in Fully-Loaded CAC
Marketing costs:
- Paid ads, content production, events, agencies
Sales salaries:
- Base pay for all sales reps and managers
Marketing salaries:
- Full marketing team compensation
Software tools:
- CRM, marketing automation, analytics, ad platforms
Overhead:
- Portion of office space, equipment, and admin costs allocated to sales/marketing
Commissions and bonuses:
- All variable compensation tied to sales
Example of fully-loaded CAC:
- Paid advertising: $40,000
- Content marketing: $10,000
- Sales salaries: $30,000
- Marketing salaries: $15,000
- Tools and software: $8,000
- Commissions: $12,000
- Allocated overhead: $5,000
- New customers: 20
Fully-Loaded CAC = $120,000 / 20 = $6,000 per customerNotice this is 50% higher than the blended CAC. Fully-loaded is more accurate for understanding true unit economics, while blended is easier to calculate and useful for high-level tracking.
CAC by Channel
Different acquisition channels have radically different costs. A customer acquired through organic search might cost you $500, while one from a sales-led enterprise deal might cost $50,000. Calculating CAC by channel helps you optimize your marketing mix.
Channel CAC = (Channel-Specific Spend) / Customers from That ChannelExample breakdown:
| Channel | Spend | Customers | CAC | Relative Efficiency |
|---|---|---|---|---|
| Referrals | $2,000 | 8 | $250 | 48x better than outbound |
| Content marketing | $15,000 | 15 | $1,000 | 12x better than outbound |
| Paid search | $20,000 | 10 | $2,000 | 6x better than outbound |
| Outbound sales | $60,000 | 5 | $12,000 | Baseline |
This reveals that your referral program has a 48x better CAC than outbound sales, suggesting where to focus optimization efforts.
CAC by Customer Segment
B2B SaaS companies often serve multiple customer segments with different acquisition costs and lifetime values. Breaking down CAC by segment is critical for strategic planning.
Segment CAC = (Spend Allocated to Segment) / New Customers in SegmentExample:
| Segment | Spend | Customers | CAC | LTV Multiple |
|---|---|---|---|---|
| SMB | $40,000 | 80 | $500 | 1x (baseline) |
| Mid-market | $80,000 | 20 | $4,000 | 8x SMB CAC |
| Enterprise | $200,000 | 5 | $40,000 | 80x SMB CAC |
While enterprise CAC is 80x higher than SMB, enterprise customers typically have 100-200x higher lifetime value, making them more profitable despite higher acquisition costs.
What Costs to Include in CAC
The most common mistake in CAC calculation is inconsistent cost inclusion. Here's a comprehensive breakdown of what should and shouldn't be counted.
Marketing Spend to Include
Paid Advertising:
- Google Ads, LinkedIn Ads, Facebook Ads
- Display advertising and retargeting
- Sponsored content and influencer partnerships
- Podcast advertising and sponsorships
Content Marketing:
- Writer and designer salaries/contractors
- Content tools and software
- SEO tools and agencies
- Video production costs
Events and Conferences:
- Booth costs and sponsorships
- Travel and accommodation for attendees
- Event materials and giveaways
- Staff time at events
Marketing Technology:
- Marketing automation platforms
- Analytics and attribution tools
- Email marketing software
- Design and creative tools
Sales Costs to Include
Personnel Costs:
- Base salaries for all sales roles (SDRs, AEs, managers)
- Commissions and bonuses
- Payroll taxes and benefits
- Recruiting and onboarding costs
Sales Tools:
- CRM system (Salesforce, HubSpot, etc.)
- Sales engagement platforms
- Prospecting and data tools
- Call recording and analytics
Sales Operations:
- Sales ops team salaries
- Training and enablement programs
- Sales content and collateral
- Demo environments and sandboxes
What NOT to Include in CAC
| Cost Category | Why Excluded |
|---|---|
| Customer Success Costs | These happen after acquisition, not during. Belongs in cost to serve. |
| Product Development | Required to build what you're selling, not to acquire customers. |
| General & Administrative | Most overhead (finance, HR, legal, facilities) should be excluded unless directly allocable. |
| Revenue-Related Costs | Payment processing fees, hosting costs are COGS, not acquisition costs. |
Key principle: Only include costs that directly contribute to turning a prospect into a paying customer.
CAC Benchmarks by Stage and Industry
What constitutes "good" customer acquisition cost depends heavily on your business model, target market, and growth stage. Here are research-backed benchmarks to evaluate your performance.
CAC by Company Stage
| Stage | ARR Range | Typical CAC | Why | Focus |
|---|---|---|---|---|
| Seed | $0-2M | $200-$2,000 | Founder-led sales, minimal team, scrappy marketing | Finding product-market fit and efficient early channels |
| Series A | $2M-10M | $500-$5,000 | Building repeatable processes, hiring sales team | Scaling what works, establishing playbooks |
| Series B+ | $10M+ | $1,000-$15,000 | Competing in established markets, moving upmarket | Market share capture, brand building, channel expansion |
CAC by Business Model
| Business Model | Typical CAC | Sales Cycle | Examples |
|---|---|---|---|
| Self-Serve SaaS | $100-$500 | Low-touch, product-led | Slack, Notion, Airtable |
| Sales-Assisted SMB | $500-$2,000 | 30-60 days | HubSpot Starter, Shopify Plus |
| Mid-Market B2B | $2,000-$10,000 | 60-90 days | Salesforce Professional, Zendesk Enterprise |
| Enterprise SaaS | $10,000-$100,000+ | 6-18 months | Workday, ServiceNow, Snowflake |
| Vertical SaaS | $1,000-$5,000 | Highly targeted | Toast, Procore, Veeva |
CAC by Average Contract Value (ACV)
Rule of thumb: CAC should be 20-40% of first-year ACV for healthy unit economics.
| ACV | Target CAC Range (20-40% of ACV) |
|---|---|
| $1,200 (small SMB) | $240-480 |
| $12,000 (mid-SMB) | $2,400-4,800 |
| $60,000 (mid-market) | $12,000-24,000 |
| $250,000+ (enterprise) | $50,000-100,000 |
If your CAC exceeds 40% of first-year revenue, you'll struggle to achieve profitability without exceptionally high retention and expansion.
CAC Payback Period
Raw CAC tells only part of the story. What matters more is how quickly you recover that acquisition cost through customer revenue. This is measured by CAC payback period.
CAC Payback Formula
CAC Payback Period (months) = CAC / (Monthly Recurring Revenue × Gross Margin)Example:
- CAC: $6,000
- Customer MRR: $500
- Gross margin: 80%
CAC Payback = $6,000 / ($500 × 0.80) = 15 monthsThis customer will take 15 months of revenue to pay back the acquisition cost, after which they become profitable.
Why Payback Matters More Than Raw CAC
You could have a CAC of $50,000, but if customers pay $10,000/month with 90% margins, your payback is under 6 months. That's exceptional.
Conversely, a CAC of $1,000 with $50/month customers at 70% margins means a 29-month payback, which is problematic for cash flow and growth.
Payback period determines how much capital you need to fund growth and how quickly you can reinvest customer revenue into acquiring more customers.
CAC Payback Benchmarks
| Payback Period | Rating | Characteristics |
|---|---|---|
| 6-12 months | World-Class | Highly efficient go-to-market, allows rapid reinvestment, typical of PLG companies |
| 12-18 months | Good | Healthy for most SaaS, sustainable with moderate capital, most venture-backed targets |
| 18-24 months | Acceptable | Works with strong retention and expansion, requires patient capital, common for enterprise |
| 24+ months | Concerning | Difficult to achieve capital-efficient growth, requires very high LTV |
LTV:CAC Ratio
The lifetime value to customer acquisition cost ratio is the ultimate measure of customer acquisition efficiency. It tells you how many dollars of profit you generate for every dollar spent acquiring customers.
The 3:1 Rule
The gold standard for SaaS is an LTV:CAC ratio of 3:1, meaning customers generate three times their acquisition cost in lifetime value.
LTV:CAC Ratio = Customer Lifetime Value / Customer Acquisition CostExample:
- CAC: $5,000
- Average customer lifetime: 4 years
- Monthly revenue per customer: $500
- Gross margin: 75%
LTV = $500 × 48 months × 0.75 = $18,000
LTV:CAC = $18,000 / $5,000 = 3.6:1
When Higher Isn't Better
Counterintuitively, an LTV:CAC ratio that's too high (like 8:1 or 10:1) often indicates you're underinvesting in growth. You're leaving money on the table by not spending more to acquire customers who would be profitable.
| LTV:CAC Ratio | Interpretation | Action |
|---|---|---|
| < 1:1 | Unsustainable, destroying value | Fix immediately or shut down |
| 1:1-3:1 | Unprofitable or barely profitable | Improve efficiency or pricing |
| 3:1-4:1 | Healthy and sustainable | This is the target zone |
| 4:1-6:1 | Very good | Consider investing more in growth |
| > 6:1 | Likely underinvesting | Increase marketing spend |
The optimal ratio balances profitability with growth rate. A 3.5:1 ratio with 100% YoY growth is better than 8:1 with 30% growth.
How to Reduce CAC
Lowering customer acquisition cost while maintaining or improving customer quality is the holy grail of SaaS efficiency. Here are proven strategies across marketing, sales, and product.
Improve Conversion Rates
Small improvements in conversion at each funnel stage compound to dramatic CAC reduction.
Funnel optimization example:
| Stage | Baseline | Improved | Impact |
|---|---|---|---|
| Visitor to Lead | 3% | 5% | 67% more leads for same traffic cost |
| Lead to Qualified Opportunity | 20% | 30% | 50% more opportunities |
| Opportunity to Customer | 30% | 40% | 33% more customers |
| End-to-End Conversion | 0.18% | 0.60% | 3.3x more customers for same spend |
Improvement tactics:
Visitor to Lead:
- Improve landing page clarity and value proposition
- Add social proof and trust signals
- Test different lead magnets and CTAs
Lead to Qualified Opportunity:
- Implement lead scoring to focus on high-intent prospects
- Improve follow-up speed (5-minute response dramatically increases conversion)
- Personalize outreach based on behavior and firmographics
Opportunity to Customer:
- Refine sales methodology and objection handling
- Improve product demos and positioning
- Streamline contracting and procurement process
Optimize Channel Mix
Different channels have vastly different CACs and scaling characteristics. Continuously test and optimize your mix.
Channel prioritization framework:
| Channel Type | CAC Level | Scalability | When to Use |
|---|---|---|---|
| Organic search (SEO) | Low | High | Always - compound ROI |
| Word-of-mouth/referrals | Low | Medium | Build into product |
| Community/UGC | Low | Medium | Long-term investment |
| Paid search | Medium | High | Scale when ROI proven |
| Email marketing | Medium | Medium | Nurture house lists |
| Partnerships | Medium | Low | Strategic channels |
| Outbound prospecting | High | Medium | High ACV only |
| Trade shows | High | Low | Brand + pipeline combo |
| Paid social | High | High | Awareness, test carefully |
Shift budget toward channels with proven ROI while testing new channels at 10-20% of budget.
Product-Led Growth Strategies
The lowest CAC companies use their product itself as the primary acquisition engine.
Freemium Models: Users experience value before paying, reducing sales friction. Dropbox, Slack, and Zoom used freemium to achieve viral growth with minimal CAC.
Free Trials: Self-serve trials let users prove value to themselves. Optimize trial length, feature access, and conversion nurture to maximize trial-to-paid conversion.
Product Virality: Build network effects and sharing into core workflows. Every Calendly link shared is free marketing. Every Loom video is a product demo.
Self-Serve Onboarding: Remove friction from getting started. The faster users reach their "aha moment," the higher trial conversion and lower support costs.
Product-led companies like Slack and Notion often achieve CACs 1/10th of traditional enterprise software because the product does the selling.
Referral and Word-of-Mouth
Your existing customers are your best salespeople.
Formal Referral Programs: Offer incentives (credits, cash, upgrades) for successful referrals. Dropbox's "give 500MB, get 500MB" program was legendary.
Make Sharing Easy: Build referral mechanisms directly into the product workflow. "Invite team members," "Share this workspace," and "Collaborate with clients" features all drive viral growth.
Customer Advocacy: Turn happy customers into vocal advocates through case studies, testimonials, reviews, and speaking opportunities. B2B buyers trust peers over marketing.
Community Building: Create spaces (Slack communities, forums, events) where users connect with each other. Strong communities drive word-of-mouth and reduce CAC.
According to Profitwell research, referred customers have 16% higher LTV and 37% better retention than customers from paid channels.
CAC in Investor Reporting
Sophisticated investors scrutinize CAC trends as a leading indicator of business health and scalability. Here's what they look for.
How VCs Evaluate CAC
CAC Trend Over Time: VCs want to see CAC staying flat or decreasing as you scale, indicating you're building competitive moats and brand recognition. Rising CAC suggests increasing competition or market saturation.
CAC Payback Trends: Improving payback period shows you're getting more efficient at monetization through better pricing, faster sales cycles, or improved onboarding.
LTV:CAC Ratio Evolution: The ratio should remain in the 3:1-4:1 zone or improve over time. Declining ratios raise concerns about market saturation or commoditization.
Cohort-Based Analysis: Investors want to see CAC analyzed by customer cohort to understand if efficiency is improving for recent acquisitions. Are you learning and optimizing over time?
CAC Metrics to Report
Include these in your investor updates:
- [ ] Blended CAC - Simple calculation for trend tracking
- [ ] Fully-Loaded CAC - True unit economics
- [ ] CAC by Channel - Shows where efficiency is improving or degrading
- [ ] CAC Payback Period - Demonstrates capital efficiency
- [ ] LTV:CAC Ratio - Confirms unit economics are healthy
- [ ] CAC Trends YoY - Shows whether scaling is improving or hurting efficiency
Red Flags That Concern Investors
| Red Flag | What It Signals | Threshold |
|---|---|---|
| Rapidly Rising CAC | Market saturation, increased competition, or loss of PMF | 20%+ QoQ increase |
| Long or Lengthening Payback | Capital inefficiency limiting growth | 24+ months or increasing |
| Low LTV:CAC Ratio | Business may not be economically viable at scale | Below 3:1 |
| Inconsistent Calculation | Trying to hide problems | Changing methodology between periods |
| Cherry-Picked Segments | Hiding overall performance | Reporting only best-performing segment |
Presenting CAC to Investors
Best practices for board decks and investor updates:
- Show the trend over 8-12 quarters - Isolated snapshots don't reveal trajectory
- Break down by cohort - Prove you're getting more efficient over time
- Include both blended and segmented - Show overall efficiency and where it comes from
- Connect to growth rate - Explain trade-offs between CAC and growth
- Address anomalies proactively - If CAC spiked, explain why before being asked
- Show improvement initiatives - Demonstrate you're actively optimizing
Conclusion
Customer acquisition cost is the foundational metric for building a sustainable, scalable SaaS business. Understanding how to calculate it correctly, benchmark it against industry standards, and optimize it over time is non-negotiable for founders and growth leaders.
Key Takeaways
- Calculate both blended and fully-loaded CAC to understand true unit economics
- Target CAC payback of 12-18 months for healthy capital efficiency
- Maintain an LTV:CAC ratio of 3:1-4:1 for sustainable growth
- Track CAC by channel and segment to optimize marketing mix
- Focus relentlessly on improving conversion rates at each funnel stage
- Build product-led growth and referral mechanisms to reduce CAC structurally
- Report CAC trends transparently to investors with cohort-based analysis
The companies that win in SaaS are those that can acquire customers profitably and predictably at scale. Master CAC, and you've mastered the unit economics that determine whether you're building a venture-scale business or a cash incinerator.