Customer Health Scoring: Framework and Implementation Guide
Build a predictive customer health scoring system that identifies at-risk accounts before they churn and uncovers hidden expansion opportunities.
Every day, your customers are making small decisions about whether your product is worth their time and money. Most of the time, you won't know they're unhappy until they cancel—or worse, until they're already telling everyone else your product doesn't work for them.
Customer health scoring changes that dynamic. It's a predictive system that flags accounts at risk of churning long before cancellation notices arrive and identifies expansion opportunities hidden in your existing customer base.
Yet despite its power, customer health scoring remains one of the least understood metrics in SaaS. Many teams cobble together manual tracking systems. Others abandon the effort after realizing they've weighted the wrong metrics. This guide will show you exactly how to build a health scoring framework that works.
What is Customer Health Scoring?
A customer health score is a numerical representation of how likely a customer is to renew, expand, or churn. It combines multiple data points—usage patterns, support interactions, business outcomes, and relationship signals—into a single number that indicates account health.
Unlike lagging indicators (like churn itself), health scores are leading indicators. They predict what will happen next month or next quarter, giving your team time to intervene.
Think of it like a patient's vital signs before they have a heart attack. A doctor doesn't wait for the patient to collapse; they watch blood pressure, cholesterol, and stress levels to predict and prevent problems. Health scores do the same for customer accounts.
The Power of Prediction
The real value of health scoring is economic. A customer acquired through sales and marketing might cost $10,000 to land. Retaining that customer costs a fraction of that—perhaps $500 in customer success resources—but preventing churn saves 100% of their lifetime value.
If your average customer lifetime value is $50,000 and you can prevent even one churn per quarter through early intervention flagged by health scores, you're already ahead. Most teams find they can prevent 2-3 churns per quarter once their health scoring system matures.
Leading indicators vs lagging indicators:
| Indicator Type | Metrics | What They Tell You |
|---|---|---|
| Lagging | Churn, NRR, Customer Lifetime Value | What already happened |
| Leading | Health scores, Engagement metrics, Support sentiment | What's about to happen |
Core Components of a Health Score
A comprehensive health score considers five categories of data:
1. Product Usage
How much is the customer actually using your product? Are they logging in regularly? Do they use core features?
2. Engagement Signals
Beyond just logging in—are they adopting new features? Inviting team members? Expanding their usage across their organization?
3. Support Interactions
How healthy is their relationship with your support team? Are tickets trending up (potential friction) or down (stable)? What's the sentiment—are they frustrated?
4. Business Outcomes
Are they achieving their goals with your product? Are they seeing ROI? This is the "are we solving their problem" question.
5. Relationship Factors
Do they have an executive sponsor? Are they engaged in quarterly business reviews? Do they attend your user conference?
Each of these categories should include multiple metrics, weighted based on their correlation to churn at your company.
Building Your Health Scoring Framework
Here's a practical framework you can adapt for your business:
The Weighted Model
The simplest approach is to assign weights to different metric categories, then score each metric within the category.
Example Framework:
| Category | Weight | Key Metrics |
|---|---|---|
| Product Usage | 40% | Monthly Active Users, Feature adoption, Time in product |
| Engagement | 25% | New features adopted, Seats added, Team growth |
| Support Health | 15% | Ticket resolution time, Volume trend, Sentiment |
| Business Outcomes | 20% | Contract value, Account growth, Goal achievement |
Within each category, you score 0-100 based on specific metrics:
Product Usage (40% weight)
- Monthly Active User rate: 30 points
- Feature adoption breadth: 10 points
- Time in product per month: 5 points
Engagement (25% weight)
- New features adopted in last 90 days: 15 points
- Seats/users added in last 90 days: 10 points
Support Health (15% weight)
- Support ticket resolution time: 10 points
- Ticket volume trend: 5 points
Business Outcomes (20% weight)
- Contract value: 10 points
- Account growth vs previous year: 10 points
Final health score = (Usage × 0.40) + (Engagement × 0.25) + (Support × 0.15) + (Business × 0.20)
This gives you a score from 0-100.
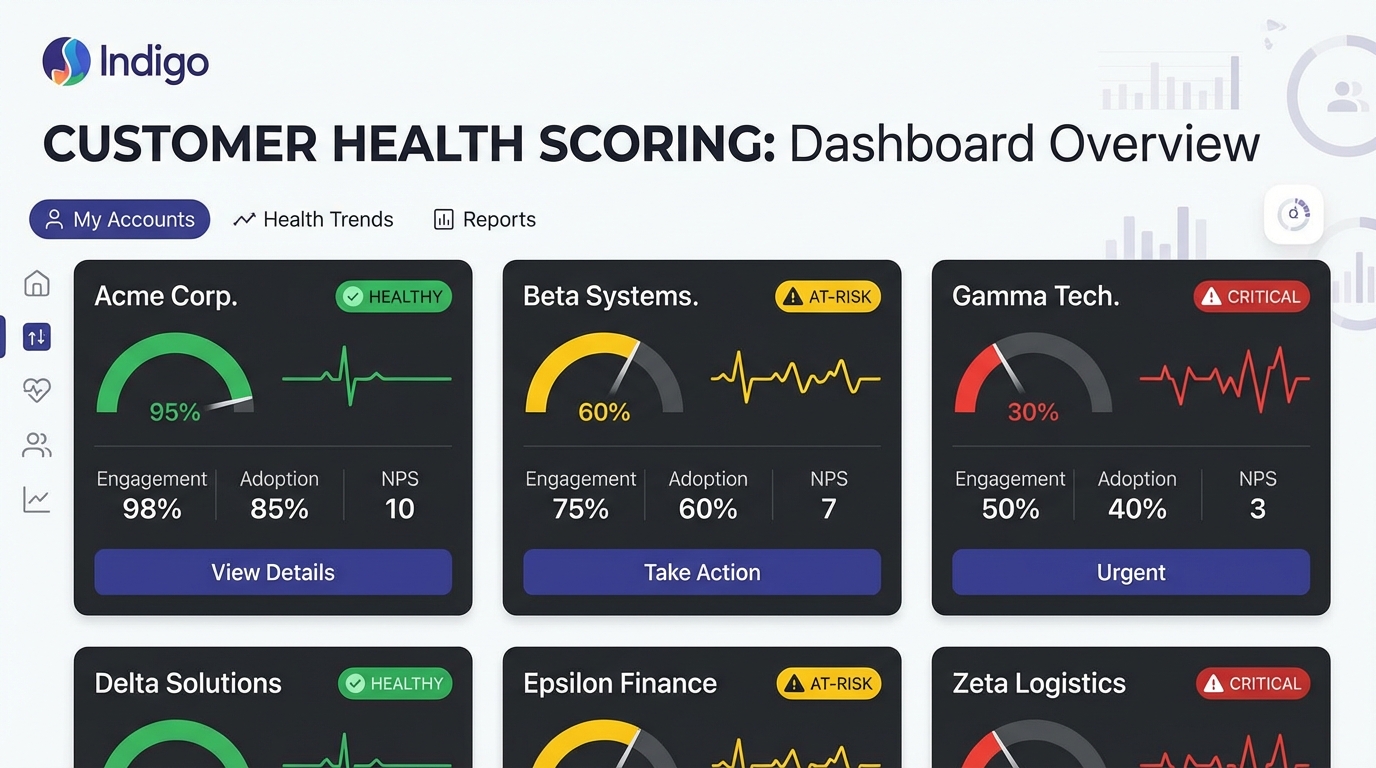
Setting Your Thresholds
Not all 0-100 scores are equally meaningful. You need thresholds that correspond to action:
| Score Range | Status | Interpretation | Action |
|---|---|---|---|
| 80-100 | Green/Healthy | Expanding or maintaining value | Proactive expansion plays |
| 50-79 | Yellow/At Risk | Declining engagement or unclear value | Intervention and re-engagement |
| 0-49 | Red/Critical | High churn risk | Immediate executive outreach |
Your team should have standard playbooks for each category.
Customizing for Your Business
The weights and thresholds above are starting points—not gospel. Your job is to find what correlates with churn at your company.
To calibrate your model:
- Look at customers who churned in the last 12 months
- What did their health scores look like 90 days before they churned?
- What metrics were weak across churned customers?
- Double-weight those metrics
For example, if you notice that 85% of churned customers had fewer than 2 active users, you know "active user count" should be heavily weighted. If churned customers never adopted your most powerful feature, that should be weighted higher than generic logins.
Key Metrics to Include
Here are the most predictive metrics across different categories:
Usage Depth Metrics
- DAU/MAU ratio - What percentage of registered users are active monthly
- Login frequency - Are they checking in regularly?
- Unique features used per month - Breadth of adoption
- Time spent in product - Quality of engagement
- Recurring usage patterns - Not one-off visits
Expansion Signals
- New users added - Growing from 5 to 15 team members is a very positive signal
- Feature adoption velocity - New features adopted per 90 days
- Module/tier upgrades - Expansion revenue is a lagging indicator of health
- Org growth - Are their headcount trends matching our usage growth?
Support Quality Signals
- Ticket sentiment - Especially trend—are questions becoming frustrations?
- First response time - Slow support is a proxy for churn risk
- Unresolved tickets - Support tickets that linger are a red flag
- Support volume trend - Are support needs increasing or decreasing?
Business Health Signals
- Contract renewal date proximity - Urgency increases as renewal approaches
- NPS/CSAT trend - If your company surveys customers, this is gold
- Executive engagement - Do they attend QBRs? User conference?
- Growth trajectory - Are they growing YoY or shrinking?
Building Your First Health Score
Don't overthink this. Start simple.
Phase 1: Minimum Viable Health Score (Weeks 1-2)
Pick 3-5 metrics you know you can measure without building complex infrastructure:
- [ ] Monthly active users (do you have this in your product database?)
- [ ] Login frequency (can you query this from analytics?)
- [ ] Time since last login (basic data)
- [ ] Support ticket count (do you have a support system?)
- [ ] Days until renewal (do you have this in your billing system?)
Score each metric 0-100. Weight them equally. Calculate: (M1 + M2 + M3 + M4 + M5) / 5
This won't be perfect, but it will be useful.
Phase 2: Validation (Weeks 3-4)
Compare your health scores to actual churned customers from the past year:
- Did churned customers have low scores?
- How many days before churn did their score drop?
- Were there false positives (high scores for customers who churned anyway)?
Adjust your weights based on what you find.
Phase 3: Expansion (Month 2+)
Once you've validated the core model, add richer metrics:
- Feature adoption breadth
- Seat expansion
- Support sentiment
- NPS trends
Each addition should increase your predictive power. Measure this.
Operationalizing Health Scores
Calculating a health score is step one. Making it useful is step two.
Weekly Health Score Reporting
Generate health scores weekly and surface them to your CS team through:
- A dashboard showing all accounts colored green/yellow/red
- An automated email highlighting newly Yellow and Red accounts
- Slackbot notifications for critical changes (Green → Red, or Red for a high-value account)
Automated Playbook Triggers
When an account moves into Yellow or Red, trigger pre-built playbooks:
| Status | Trigger | Playbook |
|---|---|---|
| Red (Critical) | Score < 50 | Email VP of CS + assigned CSM + alert for urgent outreach |
| Yellow (At Risk) | Score 50-79 | Calendar invitation to wellness check-in call + send engagement email |
| Green (Expanding) | Score 80+ | Add to next available QBR agenda + flag for expansion conversation |
Quarterly Business Review Integration
Before each QBR, the CS team should know:
- Is this account Healthy or At Risk?
- What metrics are driving the score?
- What are the top 2 actions to drive it green?
Use this to reframe the conversation from "let's discuss your success" to "we've noticed X signal—let's figure out how to improve it."
Executive Dashboard
Monthly reporting to the executive team:
- % of customers in each health band (Green/Yellow/Red)
- Trend month-over-month (are more customers going Red? That's a problem)
- Correlation between health score and renewal rate (validate the system)
- Customers approaching renewal vs current health (critical for forecasting)
Health Score Action Playbooks
A health score only matters if you do something with it.
Red Account Intervention
What it looks like:
- Customer success manager initiates emergency outreach within 24 hours
- Schedule urgent conversation with customer and executive sponsor
- Diagnostic call: what's changed? What are the top 3 problems?
- Present specific solutions or remedies
Success looks like:
- Customer commits to staying (or you understand why they want to leave)
- You've created a 30-60-90 plan to improve the health score
- Account returns to Yellow or Green within 60 days
Yellow Account Nurturing
What it looks like:
- Standard wellness check-in call (not an emergency)
- Review current usage and outcomes with the customer
- Identify 1-2 high-impact changes or features
- Present expansion opportunity (if appropriate) or educational content
Success looks like:
- Customer engagement increases
- Health score moves back to Green
- If account stays Yellow, create a clear recovery plan
Green Account Expansion
What it looks like:
- Positive QBR conversation
- Identify new use cases or team needs
- Present relevant upsell opportunities
- Expand relationship with new stakeholders
Success looks like:
- Customer sees value in expansion
- Health score remains Green
- Expansion revenue increases
Measuring Your Health Scoring System
Building the model is just the beginning. You need to measure whether it's actually working.
Key Validation Metrics
Predictive Accuracy
What percentage of accounts flagged as Red actually churned?
Target: 70%+ of Red-flagged accounts that didn't have intervention should have churned
If your accuracy is <50%, your weights are off
Lead Time
How many days before churn does the health score drop?
You need at least 14-30 days of warning to take action
If accounts go from Green to Churned in 48 hours, your metrics are too lagging
Intervention Success Rate
What percentage of intervened Red accounts stayed?
Good target: 40-50% (the hardest churns are impossible to prevent)
If you're <20%, your intervention playbook needs work
If you're >60%, your Red threshold is too aggressive
Correlation Analysis
Run a correlation matrix between health score and actual renewal rate:
| Health Band | Expected Renewal Rate |
|---|---|
| Green | 85%+ renewal |
| Yellow | 50-70% renewal |
| Red | <30% renewal |
If these don't correlate, your weights are wrong.
Common Mistakes to Avoid
1. Too Many Metrics
I've seen teams try to weight 20+ metrics. The problem: when everything is weighted, nothing is. Start with 5-7. Add more only if they improve predictive power.
2. Vanity Metrics That Don't Predict
"Logins" is a metric. But are daily logins correlated with churn? If all your customers have the same login frequency whether they renew or churn, it's not predictive—it's noise.
3. Not Updating Weights
Build your model. Validate it. Then keep validating. Every quarter, compare health scores to churn outcomes and adjust weights.
4. Ignoring Qualitative Signals
The best health scores combine quantitative metrics with CSM intuition. "Their contact person left and hasn't been replaced" is a critical signal no automated metric will catch.
5. Using Health Scores as Punitive
If your sales compensation is based on "health scores of deals closed," you're incentivizing garbage. Health scores should be used to help customers succeed, not as a weapon for internal politics.
Next Steps
Building a comprehensive health scoring framework takes time, but the payoff is significant:
Week 1: Audit
- [ ] Audit your available data
- [ ] What can you measure without building new infrastructure?
Week 2: Build MVP
- [ ] Build your minimum viable health score with 3-5 metrics
- [ ] Set up basic scoring logic
Week 3-4: Validate
- [ ] Validate against historical churn data
- [ ] Adjust weights based on findings
Month 2: Automate
- [ ] Automate weekly health score calculations
- [ ] Set up reporting dashboards
Month 3: Operationalize
- [ ] Build your action playbooks
- [ ] Integrate with CS workflows
- [ ] Train team on intervention strategies
As you scale, you'll refine the model based on what you learn. The first version won't be perfect—but it will be better than no system at all, and you'll iterate from there.
The teams winning at SaaS retention aren't the ones reacting to churn. They're the ones predicting it. Start building that system this week.