Gross Revenue Retention vs Net Revenue Retention: When Each Matters
Learn the critical differences between GRR and NRR, when to prioritize each metric, and how to use both together to diagnose SaaS business health.
Two metrics dominate SaaS health conversations: Gross Revenue Retention (GRR) and Net Revenue Retention (NRR). Ask a founder which one matters, and you'll probably get a confused answer. They know both exist but aren't sure which one to optimize for.
This confusion costs companies real money. Teams over-invest in retention features that prevent churn when they should be building expansion capabilities. Others chase expansion revenue at the expense of keeping existing customers happy. Both metrics are useful, but they answer different questions.
This guide clarifies what each metric measures, when to use them, and how to use both together to build a genuinely healthy business.
Quick Definitions
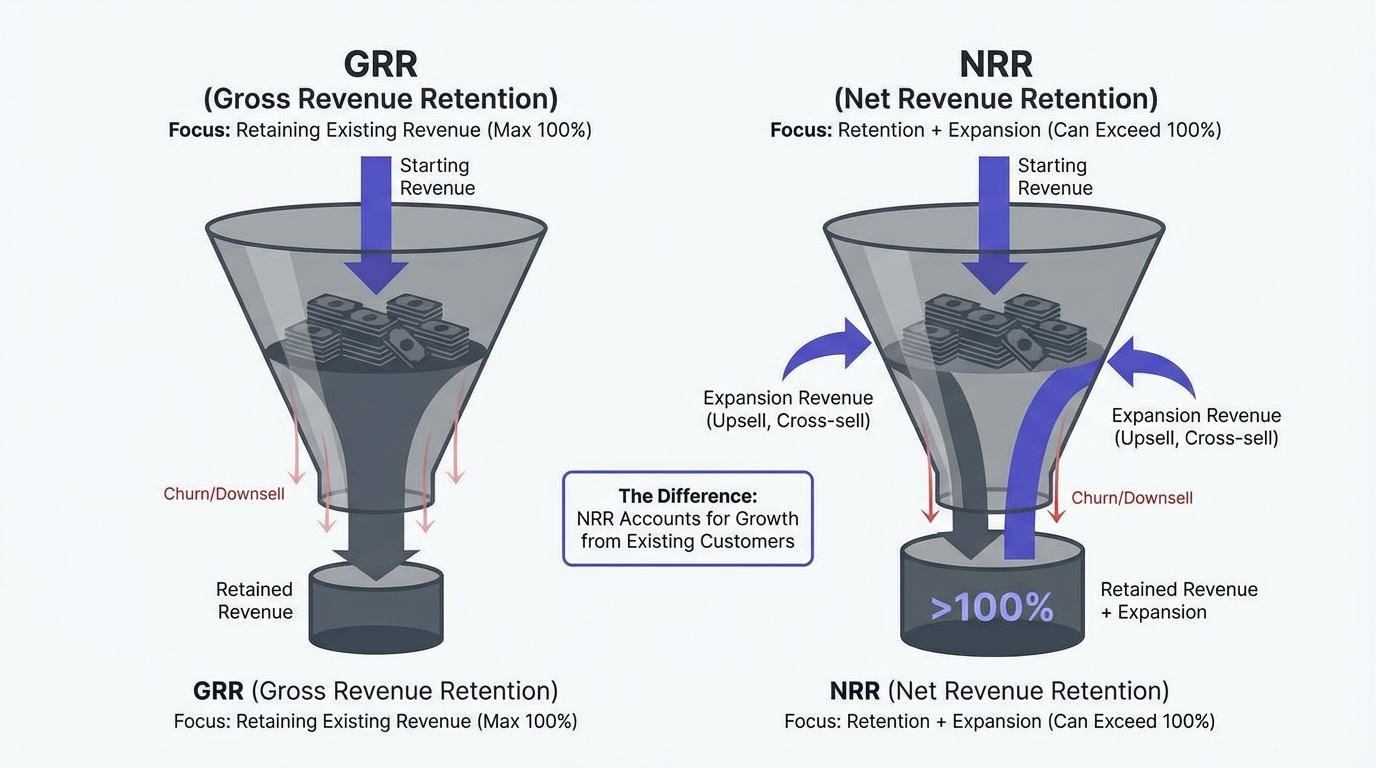
Gross Revenue Retention (GRR)
Gross revenue retention measures the percentage of revenue you retain from existing customers, excluding any expansion or upsells.
In other words: if you only kept the customers you had and didn't expand their spending, what percentage of last month's revenue would you still have?
The insight: GRR isolates churn and downgrades. It answers: "Are we losing customers? Are customers shrinking their contracts?"
Net Revenue Retention (NRR)
Net revenue retention measures the percentage of revenue you retain from existing customers, including expansion, upsells, and upgrades.
In other words: if you only counted revenue from customers you had last month (no new customer acquisition), what would your growth be?
The insight: NRR captures the full picture of customer health. It answers: "Are customers getting more valuable to us over time?"
GRR Formula
Let's define it precisely:
GRR = (Starting MRR - Churn - Contraction) / Starting MRRWhere:
- Starting MRR = Monthly Recurring Revenue from existing customers at the start of the period
- Churn = Revenue lost to cancellations
- Contraction = Revenue lost to downgrades (e.g., customer moves from $10k/month to $5k/month)
Worked Example
Start of January: $1,000,000 MRR
During January:
- Churn (cancellations): $50,000 lost
- Contraction (downgrades): $30,000 lost
- Expansion: $0 (we're not counting this for GRR)
- New customers: $0 (we're not counting this either)
GRR = ($1,000,000 - $50,000 - $30,000) / $1,000,000
GRR = $920,000 / $1,000,000
GRR = 92%
This company retained 92% of its revenue from existing customers. It lost 8% to churn and contraction.
Key Property of GRR
GRR can never exceed 100%. You're measuring how much of what you had you kept. The maximum is to keep everything (100%). You can't "over-retain" existing revenue.
If you're seeing GRR > 100%, you're actually including expansion revenue, which means you're calculating NRR, not GRR.
NRR Formula
NRR = (Starting MRR + Expansion - Churn - Contraction) / Starting MRRWhere:
- Starting MRR = Monthly Recurring Revenue from existing customers at the start of the period
- Expansion = Revenue gained from upsells, upgrades, seat expansion, usage-based increases
- Churn = Revenue lost to cancellations
- Contraction = Revenue lost to downgrades
Worked Example (Same Company)
Start of January: $1,000,000 MRR
During January:
- Churn: $50,000 lost
- Contraction: $30,000 lost
- Expansion: $120,000 gained (from upsells and upgrades)
NRR = ($1,000,000 + $120,000 - $50,000 - $30,000) / $1,000,000
NRR = $1,040,000 / $1,000,000
NRR = 104%
This company's existing customer base grew 4% in value, even after losing some revenue to churn and contraction. They're expanding faster than they're contracting.
Key Property of NRR
NRR can exceed 100%. When NRR > 100%, you're growing revenue from existing customers without acquiring any new ones. This is incredibly valuable.
Side-by-Side Comparison
Let's use the same company data to show how both metrics tell different stories:
| Metric | Formula | Result | Interpretation |
|---|---|---|---|
| GRR | ($1M - $50k - $30k) / $1M | 92% | We're losing 8% of revenue to churn/downgrades |
| NRR | ($1M + $120k - $50k - $30k) / $1M | 104% | Our customer base is growing 4% per month |
What each reveals:
- GRR (92%) says: "Churn is costing us $80k/month in lost and downgraded revenue."
- NRR (104%) says: "Actually, we're growing our customer base value. Expansion is offsetting churn."
Same company, very different stories depending on which metric you use.
When GRR Matters Most
GRR is your "floor." It shows the minimum health of your customer base.
Evaluating Product-Market Fit
When you have product-market fit, customers stick around. High GRR (90%+) signals strong product-market fit.
Low GRR (< 85%) signals:
- Customers aren't getting value from your product
- You're selling to the wrong customers
- Your product has a core problem
- Your pricing doesn't align with value delivered
If you're below 85% GRR, fixing churn is more important than building expansion features. You have a leaky bucket.
Assessing Churn Risk
Gross revenue retention directly measures churn and downgrades. If GRR is declining month-over-month, you have a churn problem. If it's stable or improving, your product is getting stickier.
Monthly GRR trend analysis:
- Jan: 92% → Feb: 91% → Mar: 90%
This trend (declining GRR) signals an accelerating churn problem, even if the absolute numbers seem OK. Investigate immediately.
Investor Due Diligence Focus
Investors care deeply about GRR because it's a leading indicator of problems. A company with high growth but declining gross retention is a red flag: "Growth is masking churn."
Typical investor expectations for GRR:
| GRR Range | Assessment | Implication |
|---|---|---|
| Above 95% | Excellent | Strong product-market fit |
| 90-95% | Good | Acceptable churn, room for improvement |
| 85-90% | Concerning | Churn is a problem you need to address |
| Below 85% | Red flag | Fundamental product or positioning issue |
When to Prioritize GRR
Focus on improving GRR if:
- [ ] GRR is declining (churn is accelerating)
- [ ] Your annual churn exceeds 25% (losing more than 1/4 of customers per year)
- [ ] New product launches haven't reduced churn
- [ ] Customers cite "product didn't deliver" as reason for cancellation
When NRR Matters Most
NRR is your "ceiling." It shows the growth potential within your existing customer base.
Measuring Growth Efficiency
NRR > 100% means you're growing without acquiring new customers. This is the holy grail of SaaS because:
- You don't need to spend on acquisition to grow
- Revenue is more predictable
- Customers are getting more valuable over time
- Unit economics improve as the business scales
Net revenue retention tells you: "Even if I stopped acquiring new customers today, would my revenue grow?"
If NRR is 120%, yes—you'd grow 20% per month just from existing customers. This is incredibly valuable.
Evaluating Expansion Motion
NRR directly measures whether your upsells, cross-sells, and usage-based pricing are working.
Declining NRR (e.g., from 115% to 110%) signals:
- Expansion revenue is slowing
- Customers aren't adopting higher-value features
- Your pricing model isn't capturing customer value growth
- You need to improve your expansion motion
Rising NRR (e.g., from 100% to 110%) signals:
- Customers are finding more value
- Your pricing model is capturing that value
- You have a strong land-and-expand motion
- Existing customers are your best growth engine
Investor Headline Metric
NRR has become the headline metric for investor conversations because it proves scalability without acquisition spend.
Typical investor expectations for NRR:
| NRR Range | Assessment | Implication |
|---|---|---|
| Below 100% | Concerning | You're shrinking from existing customers (churn > expansion) |
| 100-110% | Good | You're growing modestly from existing customers |
| 110-120% | Excellent | Expansion is driving significant growth |
| 120%+ | Elite | You have a compounding business |
For a Series A company, hitting NRR > 100% is a huge signal. For a Series C company, investors expect NRR > 110%.
When to Prioritize NRR
Focus on improving NRR if:
- [ ] NRR is already healthy (> 100%)
- [ ] GRR is stable and not declining
- [ ] You have product-market fit in your initial use case
- [ ] You want to accelerate growth without burning cash on acquisition
Using Both Together: Diagnostic Framework
GRR and NRR together tell you a complete story about customer health.
The 2x2 Framework
| NRR > 100% | NRR < 100% | |
|---|---|---|
| GRR > 90% | Healthy & Growing<br/>Scale acquisition | Weak Expansion<br/>Churn is offsetting expansion |
| GRR < 90% | Expansion Masking Churn<br/>Fix retention first | Critical<br/>Churn + contraction > expansion |
Scenario 1: GRR 95%, NRR 115%
Interpretation: Excellent. You have strong retention (low churn) and strong expansion. This is the ideal state.
Action: Scale acquisition. You have a machine that turns customers into increasingly valuable relationships. Let growth accelerate.
Scenario 2: GRR 85%, NRR 105%
Interpretation: Expansion is masking a churn problem. Yes, you're growing because upsells are offsetting churn, but you're losing customers.
Action: Investigate churn. What's causing customers to leave? Are you replacing them with larger upsells from fewer customers? This is sustainable short-term but risky long-term. Fix churn.
Scenario 3: GRR 95%, NRR 98%
Interpretation: Strong retention but weak expansion. Customers are sticking around but not upgrading. You're not capturing their growing value.
Action: Invest in expansion. Build higher-value features, improve upsell motions, create clear upgrade paths. Your customers are happy, but you're leaving revenue on the table.
Scenario 4: GRR 80%, NRR 85%
Interpretation: Both retention and expansion are weak. You have a fundamental problem. Expansion revenue isn't even offsetting churn.
Action: Pause growth acquisition. Fix product-market fit and churn first. You're bleeding customers faster than you can expand them. Growth will only make this worse.
Red Flags to Watch
Declining GRR with stable NRR:
- Your expansion revenue is increasing even as churn accelerates
- Question: Are you upselling to customers right before they churn?
- Risk: You're cannibalizing future revenue
Rapidly declining NRR:
- Expansion revenue is drying up
- Customers stopped upgrading or started using less (usage-based contracts)
- Question: Did a competitor enter? Did product quality decline?
NRR > GRR but both < 100%:
- Expansion is growing, but churn is still the dominant factor
- You're on a treadmill: losing customers but offsetting with upsells from shrinking base
- Risk: Eventually you'll run out of customers to upsell
Common Mistakes to Avoid
Mistake 1: Conflating GRR and NRR
Using them interchangeably or presenting one as the other. "Our GRR is 105%" actually means your NRR is 105%; GRR can't exceed 100%.
Fix: Define explicitly. Report both metrics separately. Explain what each means for your business.
Mistake 2: Only Tracking One
Some companies obsess over NRR (especially if it's > 100%) and ignore GRR.
But if GRR is 85% and NRR is 110%, your business is actually sick. You're growing because upsells are offsetting rapid churn. Eventually, you'll run out of customers to upsell.
Fix: Report both metrics monthly. Set targets for both. Diagnose problems by looking at both.
Mistake 3: Inconsistent Calculation Periods
Calculating January GRR as "January ending MRR" and February GRR as "February average MRR" introduces calculation error and makes trends meaningless.
Fix: Use consistent methodology. Month-over-month GRR uses:
- Starting MRR = MRR at the start of the month (same as prior month's ending MRR)
- Changes during the month (churn, contraction, expansion)
- Ending MRR = MRR at the end of the month
Mistake 4: Ignoring Cohort Analysis
"Our company NRR is 110%" masks huge variation. Your Enterprise cohort might be 130% NRR (they're expanding like crazy) while your SMB cohort is 95% (they're churning).
Blended metrics hide problems. You need to see:
- GRR and NRR by customer segment
- GRR and NRR by cohort (customers acquired in the same period)
- GRR and NRR by use case
Fix: Calculate separately by segment. Manage each segment with segment-specific targets.
Mistake 5: Not Accounting for Timing
If a customer churns on Day 25 of the month, should their revenue count in GRR?
Standard approach: Count revenue for the full period, even if they churned partway through. This measures: "Of the revenue I had, how much did I retain?"
But some companies use "accrual" accounting where a Day 25 churn only counts for partial month. This changes the number.
Fix: Define methodology once. Use consistent accrual/revenue recognition approach. Document it. Stick with it.
Improving Both GRR and NRR
You don't have to choose between retention and expansion. You can improve both.
Improving GRR (Reducing Churn)
1. Improve onboarding: Customers who hit value faster churn less. Reduce time-to-first-value.
2. Product quality: Invest in stability, performance, and reliability. Bugs drive churn.
3. Customer health tracking: Implement health scoring. Identify at-risk customers and intervene before churn.
4. Renewal discipline: Proactive renewal conversations 60 days before expiration prevent surprises.
5. Build switching costs: Integrations, custom workflows, and data lock-in make it expensive to leave.
Expected impact: Each 1% reduction in churn = 5-10% improvement in GRR over a year.
Improving NRR (Increasing Expansion)
1. Usage-based pricing: Charge customers for actual value delivered. More usage = higher bills, but also stronger stickiness.
2. Feature-gated pricing: Create clear upgrade paths. Higher tiers unlock premium features, advanced analytics, API access, higher limits.
3. Seat expansion: Make adding new team members trivial and encourage it through usage analytics that show "you have 8 people actively using this."
4. Professional services: High-margin services (implementation, training, custom features) deepen relationships and increase ARPU.
5. Ecosystem/integrations: Partner integrations can drive additional revenue and increase switching costs.
Expected impact: Good expansion motion can add 5-20% per year to NRR depending on your product and pricing model.
Retention Metrics: A Complete Picture
To truly understand customer health, report these metrics together:
Monthly Report:
- GRR: 93%
- NRR: 112%
- Churn Rate: 4% (customers lost / starting customers)
- Expansion Rate: 15% (expansion revenue / starting revenue)
- Contraction Rate: 3% (contraction revenue / starting revenue)
- CAC Payback Period: 8 months

Quarterly Trend:
Q3: GRR 92%, NRR 108%
Q4: GRR 93%, NRR 110%
Q1: GRR 93%, NRR 112%

Cohort Analysis (1-year retention):
Enterprise cohort: GRR 96%, NRR 125%
Mid-Market cohort: GRR 91%, NRR 105%
SMB cohort: GRR 88%, NRR 95%
This gives investors and your team a complete picture: which customers are staying, which are expanding, and where to focus.
Setting Targets by Segment
Different customer segments have different natural GRR and NRR levels. Set segment-specific targets:
| Segment | GRR Target | NRR Target | Why |
|---|---|---|---|
| Enterprise | 95%+ | 120%+ | High switching costs, large expansion opportunities |
| Mid-Market | 92%+ | 105%+ | Moderate switching costs, moderate expansion |
| SMB | 88%+ | 95%+ | Low switching costs, lower expansion revenue |
| PLG | 90%+ | 110%+ | Lower churn due to low/no acquisition, strong expansion |
Enterprise NRR significantly exceeds SMB NRR in most businesses. Enterprise customers have more seats, more use cases, and more budget to expand. Don't expect SMB to have 120% NRR.
Conclusion
Gross revenue retention and net revenue retention are complementary metrics that answer different questions:
- GRR answers: "Do customers stay with us? Are we losing them to churn?"
- NRR answers: "Do customers grow with us? Are we expanding their value?"
Neither alone tells the full story. A company with 95% GRR but 90% NRR has weak expansion despite good retention. A company with 85% GRR but 110% NRR is growing despite losing customers—unsustainable long-term.
The healthiest SaaS companies have both:
- GRR > 90% (low churn, strong product-market fit)
- NRR > 110% (strong expansion, growing customer lifetime value)
Start by measuring both accurately. Then diagnose which one to focus on. Fix churn first (improve GRR). Build expansion second (improve NRR). Do both well, and you've built a compounding business that grows faster and faster over time.