Net Revenue Retention: The Ultimate Guide (NRR)
Master NRR calculation and optimization strategies. Learn how to calculate net revenue retention, benchmark against top SaaS companies, and build a 120%+ expansion engine.
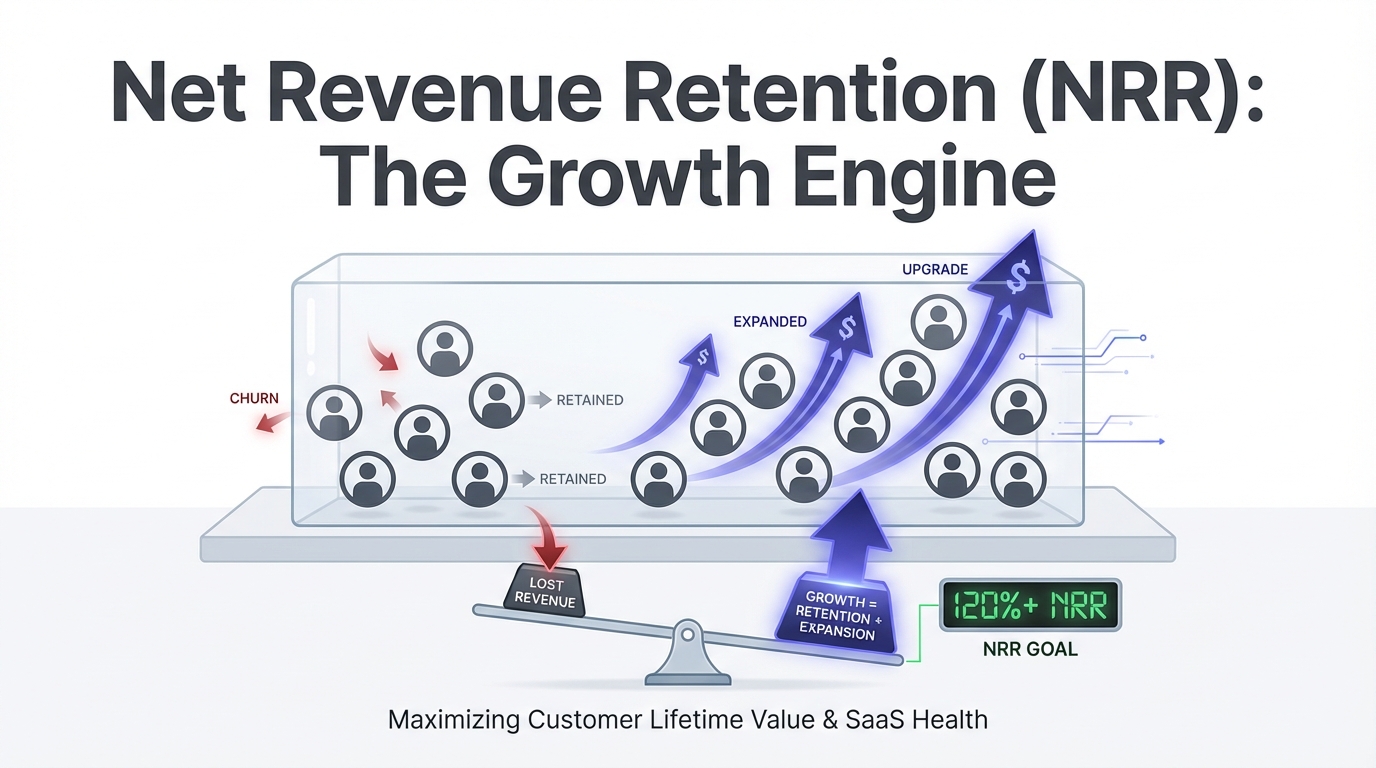
If you're building a SaaS business, there's one metric that matters more than any other to investors: Net Revenue Retention (NRR). While new customer acquisition gets most of the attention, NRR reveals whether you've built a business that naturally grows or one that's constantly refilling a leaky bucket.
Companies with NRR above 120% can grow significantly even with zero new customers. Those below 100% are fighting an uphill battle, losing revenue from their existing base faster than they can replace it. This guide will show you exactly how to calculate NRR, benchmark it against industry standards, and build the expansion engine that separates category winners from also-rans.
What is Net Revenue Retention?
Net Revenue Retention (NRR), also called Net Dollar Retention (NDR), measures how much recurring revenue you retain from existing customers over time, including expansions, downgrades, and churn. It answers a critical question: if you stopped acquiring new customers today, would your revenue grow or shrink?
NRR is calculated by taking a cohort of customers from a specific time period and tracking their revenue changes over the subsequent 12 months, including all upsells, cross-sells, downgrades, and cancellations.
NRR vs NDR: Same Metric, Different Names
Net Revenue Retention (NRR) and Net Dollar Retention (NDR) are identical metrics with different names. The industry uses both terms interchangeably, though NRR has become more common in recent years.
Don't be confused if you see both in investor decks and financial reports - they mean exactly the same thing.
Why NRR is the "Growth Efficiency" Metric
NRR reveals the quality and durability of your revenue in a way that growth rate alone cannot. A company growing 100% year-over-year with 80% NRR is fundamentally different from one growing 100% with 120% NRR.
The 80% NRR company is losing 20% of its revenue base annually, meaning it must acquire enough new customers to replace that 20% plus add 100% more just to achieve 100% growth. That's a 120% new customer requirement.
The 120% NRR company is already growing 20% from its existing base, meaning it only needs 80% new customer growth to achieve the same 100% overall growth rate. That's a massive efficiency advantage.
As Chris Degnan of Snowflake famously said: "Revenue from existing customers is the fuel that powers growth. New customers are the spark, but NRR is the engine."
The Compounding Effect of High NRR
NRR compounds over time in ways that dramatically impact long-term business value. Here's how different NRR levels affect a $1M starting cohort over 5 years:
| NRR Rate | Year 1 | Year 2 | Year 3 | Year 4 | Year 5 | Total Change |
|---|---|---|---|---|---|---|
| 80% NRR | $800K | $640K | $512K | $410K | $328K | -67% |
| 100% NRR | $1M | $1M | $1M | $1M | $1M | Flat |
| 120% NRR | $1.2M | $1.44M | $1.73M | $2.07M | $2.49M | +149% |
| 130% NRR | $1.3M | $1.69M | $2.20M | $2.86M | $3.71M | +271% |
A company with 130% NRR nearly quadruples revenue from existing customers over five years, while one with 80% NRR loses two-thirds. This compounding effect is why public SaaS companies with high NRR trade at premium valuations.
NRR Formula and Calculation
The standard NRR formula tracks a cohort of customers over a 12-month period:
NRR = (Starting MRR + Expansion - Contraction - Churn) / Starting MRR × 100%Where:
- Starting MRR: Total recurring revenue from a cohort at the beginning of the period
- Expansion: Revenue increases from upsells, cross-sells, and price increases
- Contraction: Revenue decreases from downgrades
- Churn: Revenue lost from canceled customers
Important: Only track revenue changes from the original cohort. Do not include revenue from new customers acquired during the measurement period.
Worked Example: Annual NRR Calculation
Let's calculate NRR for a cohort of customers who were active on January 1, 2024.
Starting Position (Jan 1, 2024):
- 100 customers
- Total MRR: $500,000
- Average MRR per customer: $5,000
Changes Over 12 Months:
- Expansion revenue: $120,000 (upsells and cross-sells)
- Contraction revenue: $30,000 (downgrades)
- Churned revenue: $50,000 (10 customers canceled)
Ending Position (Dec 31, 2024):
- 90 customers remaining (10 churned)
- Total MRR from original cohort: $540,000
NRR Calculation:
NRR = ($500,000 + $120,000 - $30,000 - $50,000) / $500,000
NRR = $540,000 / $500,000
NRR = 1.08 = 108%
This company retained 108% of its revenue, meaning the cohort grew 8% over the year despite losing 10% of customers to churn.
Monthly vs Annual Calculation
While NRR is typically reported annually, you can calculate it monthly for faster feedback loops.
Monthly NRR Calculation: Track the same cohort month-over-month using the same formula. To annualize monthly NRR for comparison:
Annualized NRR = (Monthly NRR)^12Example: If your monthly NRR is 101% (1.01):
Annualized = 1.01^12 = 1.127 = 112.7%Monthly tracking helps you spot trends early, but annual NRR is the standard for investor reporting and benchmarking.
Cohort-Based NRR Analysis
The most insightful way to analyze NRR is by customer cohort (the month/quarter they first became customers). This reveals whether retention is improving over time as you refine your product and customer success practices.
Cohort Analysis Table Example:
| Cohort | Starting Customers | 12-Month NRR | 24-Month NRR | Trend |
|---|---|---|---|---|
| Q1 2022 | 50 | 95% | 88% | Improving from baseline |
| Q2 2022 | 75 | 98% | 92% | Learning and iterating |
| Q3 2022 | 100 | 105% | 98% | Crossed 100% threshold |
| Q4 2022 | 120 | 110% | 105% | Strong expansion engine |
| Q1 2023 | 140 | 115% | (pending) | Continued improvement |
This table shows improving NRR over time, indicating the company is getting better at retaining and expanding customers. Investors love seeing this trend because it proves the business is learning and improving unit economics.
NRR vs GRR: Understanding Both
Net Revenue Retention (NRR) has a closely related cousin: Gross Revenue Retention (GRR). Both are critical, but they measure different aspects of retention health.
Gross Revenue Retention (GRR) Defined
Gross Revenue Retention measures how much revenue you retain from existing customers, excluding any expansion revenue. It only counts the downside: downgrades and churn.
GRR = (Starting MRR - Contraction - Churn) / Starting MRR × 100%Using our earlier example:
GRR = ($500,000 - $30,000 - $50,000) / $500,000
GRR = $420,000 / $500,000
GRR = 84%
GRR can never exceed 100% because it explicitly excludes expansion. It represents your baseline retention floor - what you'd retain in a world with no upsells.
When Each Metric Matters
GRR reveals product-market fit and core value delivery:
| GRR Range | Interpretation |
|---|---|
| Below 85% | Significant churn problem, core product may have weak PMF |
| 85-90% | Acceptable for SMB markets with natural churn |
| 90-95% | Good retention, strong core value |
| 95%+ | Excellent retention, likely enterprise/mid-market |
NRR reveals expansion potential and monetization effectiveness:
| NRR Range | Interpretation |
|---|---|
| Below 100% | Losing revenue despite expansion, serious churn problem |
| 100-110% | Retention is fine but limited expansion |
| 110-120% | Good expansion offsetting moderate churn |
| 120%+ | Exceptional expansion engine |
The Relationship Between GRR and NRR
The gap between NRR and GRR reveals how much expansion is masking underlying retention problems:
Expansion Rate = NRR - GRRScenario Analysis:
| Scenario | GRR | NRR | Expansion | Analysis |
|---|---|---|---|---|
| A: Strong Foundation | 95% | 115% | 20% | Excellent core retention with meaningful expansion |
| B: Expansion Masking Churn | 75% | 105% | 30% | Expansion papering over 25% revenue leak - fix core retention first |
| C: Untapped Potential | 100% | 105% | 5% | Zero churn but weak expansion - need pricing/packaging work |
Why You Need Both Metrics
Tracking only NRR can hide serious problems. A company with 80% GRR and 115% NRR looks fine on NRR alone, but that 35% expansion requirement to achieve net growth is masking a fundamental retention problem that will eventually constrain growth.
Best-in-class SaaS companies aim for:
- GRR: 90%+
- NRR: 120%+
- Expansion: 30%+
This combination indicates strong core retention, excellent expansion, and sustainable growth mechanics.
NRR Benchmarks
What constitutes "good" NRR varies by market segment, business model, and company stage. Here are comprehensive benchmarks based on public SaaS company data and venture capital research.
Universal NRR Benchmarks
| NRR Range | Rating | Implication |
|---|---|---|
| Below 100% | Red flag | Losing revenue from existing customers |
| 100-110% | Acceptable | Leaves room for improvement |
| 110-120% | Good | Meeting investor expectations |
| 120-130% | Excellent | Top-quartile performance |
| 130%+ | Exceptional | Category-leading retention and expansion |
NRR by Company Stage
| Stage | ARR Range | Expected NRR | Focus Area |
|---|---|---|---|
| Seed | $0-2M | 100%+ | Establish core retention, expect volatility |
| Series A | $2M-10M | 105-115% | Stabilize churn, build expansion playbook |
| Series B+ | $10M-50M | 115-125% | Scale customer success, optimize pricing |
| Pre-IPO/Public | $50M+ | 120-130%+ | Maintain NRR at scale |
NRR by Market Segment
| Segment | ACV Range | Typical NRR | Challenge | Win Condition | Examples |
|---|---|---|---|---|---|
| SMB | Under $5K | 90-105% | Higher natural churn (business failure rate) | Exceptional product stickiness and PLG expansion | Shopify ~95%, Wix ~90% |
| Mid-Market | $5K-50K | 105-120% | Moderate churn, competitive markets | Strong customer success and expansion programs | HubSpot 110-115%, Zendesk 110% |
| Enterprise | $50K+ | 120-140% | Complex deployments, higher expectations | Strategic relationships, land-and-expand motion | Snowflake 165%, Datadog 130%, ServiceNow 125% |
| Vertical SaaS | Varies | 110-125% | Limited expansion opportunities (fixed use case) | Exceptional retention due to switching costs | Toast 120%, Veeva 120% |
NRR by Business Model
| Pricing Model | Typical NRR | Why | Examples |
|---|---|---|---|
| Usage-Based | 120-140% | Customer growth naturally drives revenue expansion | Snowflake 165%, Datadog 130%, Twilio 115% |
| Seat-Based | 110-120% | Expansion requires hiring or org changes | Slack 120%, Zoom 115%, Atlassian 110% |
| Flat-Rate/Module | 105-115% | Expansion requires deliberate upsell conversations | Many traditional B2B SaaS |
| Consumption Hybrid | 115-130% | Base pricing plus usage expansion | Adobe 110-115%, Microsoft 365 |
Public SaaS NRR Leaders (2024)
These companies represent the gold standard:
| Company | NRR | Business Model |
|---|---|---|
| Snowflake | 158% | Usage-based infrastructure |
| HashiCorp | 140% | Developer platform expansion |
| Datadog | 130% | Infrastructure monitoring growth |
| ServiceNow | 125% | Enterprise workflow expansion |
| Cloudflare | 125% | Usage and feature expansion |
| Crowdstrike | 124% | Security platform consolidation |
| Zoominfo | 120% | Seats and data expansion |
| Salesforce | 115% | Multicloud adoption |
Components of NRR
Understanding what drives NRR helps you diagnose problems and identify opportunities. Let's break down the three components and how they interact.
Expansion Revenue
Expansion is revenue growth from existing customers through:
| Expansion Type | Description | Example |
|---|---|---|
| Upsells | Moving to higher-tier plans with more features/capacity | SMB plan → Professional plan |
| Cross-Sells | Adding additional products or modules | Adding marketing automation to existing CRM |
| Price Increases | Raising prices through renewals or annual increases | 5% annual price increase clause |
| Usage Growth | Natural expansion as customers scale (usage-based models) | API calls, data processed, messages sent increasing |
Expansion Strategies by Model
Product-Led Expansion:
- Build expansion into product (usage limits, feature gates)
- Make upgrades self-serve and frictionless
- Use in-app prompts when users hit limits
Customer Success-Led Expansion:
- Quarterly business reviews identifying growth opportunities
- Proactive outreach when usage patterns suggest readiness
- Executive relationships enabling strategic upsells
Sales-Led Expansion:
- Dedicated account management for high-value customers
- Annual renewal conversations including expansion discussions
- Strategic account planning with expansion targets
Contraction Revenue
Contraction is revenue decrease from existing customers through:
Downgrades:
- Business downturn or budget cuts
- Overbuying initially, right-sizing usage
- Removing users who left the company
Usage Decreases:
- Seasonal variation in business activity
- Product adoption declining (concerning)
- Customer finding alternative solutions (very concerning)
Seat Reductions:
- Layoffs or team reorganizations
- Consolidating licenses (efficiency gain for customer)
- Department no longer using product
Mitigating Contraction
- Usage-based pricing with minimums prevents sudden drops
- Annual contracts lock in revenue vs. monthly flexibility
- Enterprise agreements with committed spend
- Customer health monitoring for early intervention
Churn (Logo Loss)
Churn is complete cancellation, losing the customer entirely. This is the most damaging component because you lose 100% of that revenue.
| Churn Type | Causes | Mitigation |
|---|---|---|
| Involuntary | Failed payments, business closure (especially SMB) | Payment retry logic, proactive payment updates |
| Product | Doesn't achieve value, competitor offers better solution | Better onboarding, customer success intervention |
| Price | Too expensive, budget cuts, price increase triggers exit | Downgrade options, pause features, flexible contracts |
| Relationship | Poor support, champion leaves, new leadership wants different tools | Multi-threaded relationships, executive engagement |
How Each Component Impacts NRR
Using real numbers to show component impact on 100 customers with $500K starting MRR:
| Scenario | Expansion | Contraction | Churn | Net Change | NRR |
|---|---|---|---|---|---|
| Baseline | $50K (+10%) | $30K (-6%) | $70K (-14%) | -$50K | 90% |
| Improve Expansion | $130K (+26%) | $30K (-6%) | $70K (-14%) | +$30K | 106% |
| Reduce Churn | $50K (+10%) | $30K (-6%) | $20K (-4%) | $0 | 100% |
| Combined | $130K (+26%) | $30K (-6%) | $20K (-4%) | +$100K | 120% |
This shows that pulling both expansion and churn reduction levers is the path to exceptional NRR.
Strategies to Improve NRR
Improving NRR requires a multi-faceted approach across product, customer success, and pricing. Here are proven strategies from high-performing SaaS companies.
Build Expansion Into the Product
The most efficient expansion doesn't require sales conversations - it happens naturally through product usage.
Usage-Based Components: Even if your base pricing is seat-based, add usage dimensions that grow with customer success.
Examples:
- Slack charges per active user but could add message storage
- Asana has seat pricing plus guest collaborators
- Notion combines workspace seats with content/file storage
Feature Gating: Tier features so successful customers naturally outgrow their plan:
- Advanced analytics for power users
- API access or integrations for scaling teams
- White-labeling for customer-facing use cases
- Premium support tiers (faster response, dedicated CSM)
Viral Expansion Mechanisms: Build product features that require inviting more users:
- Collaboration features (docs, projects, workspaces)
- Review and approval workflows
- Client or external stakeholder access
- Cross-functional tools (sales + marketing + service)
Data Network Effects: The more data customers add, the more valuable the product becomes, preventing churn and enabling price increases:
- CRM with historical customer data
- Analytics platforms with trend analysis
- Knowledge bases with accumulated institutional knowledge
Customer Health Scoring and Intervention
Proactively identify at-risk customers before they churn or downgrade.
Health Score Components
- Product Usage: Login frequency, feature adoption, active users
- Engagement: Support tickets, response to outreach, NPS scores
- Commercial: Payment history, contract renewal timing, expansion conversations
- Relationship: Executive sponsor engagement, QBR participation
Intervention Playbooks
| Health Status | Actions |
|---|---|
| Red (High Churn Risk) | Immediate account manager outreach, executive escalation for strategic accounts, deep-dive problem session, expedited feature requests |
| Yellow (Declining Engagement) | Proactive CSM check-in, share success stories from similar customers, offer training session, identify and activate new champions |
| Green (Expansion Ready) | Introduce new relevant features, share expansion case study, invite to advisory board/beta programs, QBR focused on strategic planning |
Pricing and Packaging Optimization
How you price and package directly impacts expansion and retention.
Good-Better-Best Tiering: Design tiers with clear upgrade paths:
- Entry tier captures budget-conscious customers
- Mid tier offers best value for typical customer
- Top tier provides unlimited/enterprise features
Anchor High-Value Features: Place features customers value most in upper tiers:
- Advanced reporting and analytics
- Priority support or dedicated CSM
- Security and compliance features
- Custom integrations and API access
Remove Friction from Upgrades:
- Make plan changes instant (no sales call required for SMB)
- Pro-rate upgrades fairly (credit unused time)
- Allow trial of higher tier before committing
- Provide upgrade recommendations based on usage
Annual vs Monthly Incentives: Annual contracts improve NRR and cash flow:
- 15-20% discount on annual vs monthly
- Additional features only on annual (like priority support)
- Committed usage minimums with annual only
Minimize Downgrades with "Pause" Options: Instead of letting customers downgrade or cancel:
- Seasonal pause for cyclical businesses
- Temporary feature reduction without full downgrade
- Grace periods for customers with temporary budget issues
Usage-Based Pricing Benefits for NRR
Companies with usage-based components consistently achieve higher NRR.
Automatic Expansion: As customers grow their business, revenue grows proportionally without requiring sales conversations:
- Twilio revenue expands with customer's SMS/call volume
- Snowflake revenue expands with customer's data warehouse usage
- Stripe revenue expands with customer's payment processing
Alignment with Value: Customers perceive the pricing as fair because they pay for what they use:
- Lower barrier to entry (can start small)
- Growth is self-funded (expansion pays for itself)
- Less likely to over-buy or under-utilize
Natural Expansion Protection: Usage pricing makes it harder for competitors to displace you:
- Switching costs include replatforming and volume
- Migrations are complex and risky
- Value grows over time through data accumulation
Implementation Considerations:
- Ensure usage correlates with value delivered
- Set pricing that allows meaningful margins at scale
- Provide usage visibility and predictability
- Consider hybrid model (base + usage) for revenue stability
NRR in Investor Conversations
For SaaS companies raising capital or preparing for IPO, NRR is often the first metric sophisticated investors want to see. Here's how to present it effectively.
How VCs Evaluate NRR
Absolute NRR Number: VCs have clear benchmarks by stage and market:
- Series A: 105%+ is acceptable, 110%+ is strong
- Series B: 110%+ is acceptable, 115%+ is strong
- Series C+: 120%+ is expected for high-growth companies
NRR Trend Over Time: More important than a single number is the trajectory:
- Improving NRR shows you're getting better at retention and expansion
- Stable NRR proves your model is repeatable
- Declining NRR is a major red flag suggesting market saturation or product issues
Cohort-Based NRR: Investors want to see NRR broken down by cohort to understand:
- Are recent cohorts better or worse than older ones?
- Is NRR improvement coming from product enhancements (recent cohorts better) or pure time (older cohorts expand more)?
- What's the difference between enterprise vs SMB cohorts?
GRR Context: Sophisticated investors will ask for both NRR and GRR:
- They want to see strong GRR (90%+) as the foundation
- Large gap between NRR and GRR suggests expansion is masking churn problems
- Best companies have high GRR AND high expansion
NRR Trends Matter More Than Snapshots
A company with 105% NRR today but improving 5 points per quarter is more attractive than one with 125% NRR that's declining. Investors underwrite trends, not moments in time.
Positive Trends:
- "Our NRR improved from 105% to 115% over the last year as we rolled out our expansion playbook"
- "We've reduced churn by 30% through better customer success processes"
- "Recent cohorts are showing 10 points higher NRR than cohorts from a year ago"
Concerning Trends:
- "NRR declined from 120% to 110% as we expanded into SMB"
- "Expansion revenue is flat quarter-over-quarter"
- "Older cohorts have higher NRR than recent ones" (suggests product was better before)
Cohort Analysis Presentation
When presenting NRR to investors, use cohort analysis tables like this:
| Customer Cohort | 12-Mo NRR | 24-Mo NRR | 36-Mo NRR | Cohort Size (ARR) |
|---|---|---|---|---|
| 2021 | 115% | 128% | 142% | $2M |
| 2022 | 118% | 132% | - | $5M |
| 2023 | 122% | - | - | $12M |
| 2024 | 125% | - | - | $20M |
This table tells a powerful story:
- NRR improves with time (12-mo → 24-mo → 36-mo)
- Recent cohorts have better early NRR (showing improvement)
- Larger recent cohorts prove the model scales
Red Flags That Concern Investors
| Red Flag | What It Signals |
|---|---|
| NRR Below 100% | Losing revenue from existing customers is unsustainable. Questions about PMF. |
| Declining NRR QoQ | Increasing competition, weakening product value, or market saturation |
| NRR Dependent on Price Increases | Not sustainable long-term if expansion comes mainly from raising prices |
| Large NRR Variance Between Segments | If enterprise NRR is 140% but SMB is 85%, segment strategy concerns |
| GRR Below 85% | Even with strong expansion, fundamental retention problems will constrain growth |
| Opaque Calculation | Changing methodology or being vague suggests hiding problems |
Presenting NRR to Investors: Best Practices
In Your Board Deck:
- Lead with headline NRR and GRR numbers (current quarter)
- Show 8-quarter trend line for both metrics
- Break down NRR components (expansion, contraction, churn)
- Present cohort analysis by vintage
- Segment analysis (enterprise vs SMB, industry verticals, etc.)
- Forward-looking initiatives to improve NRR
In Fundraising Materials:
- Highlight NRR prominently in executive summary
- Compare to relevant public company benchmarks
- Show cohort improvement over time
- Explain expansion mechanics and scalability
- Detail customer success and expansion playbooks
- Share specific customer expansion case studies
In Investor Conversations:
- [ ] Be ready to explain calculation methodology precisely
- [ ] Discuss both wins and challenges transparently
- [ ] Show you understand the drivers and have improvement plans
- [ ] Connect NRR to overall growth efficiency and CAC payback
- [ ] Demonstrate understanding of segment differences
- [ ] Share specific tactical initiatives underway
Common NRR Mistakes
Even experienced operators make calculation and interpretation errors with NRR. Avoid these common pitfalls.
Inconsistent Calculation Methods
Problem: Changing what you include in NRR between reporting periods makes trends meaningless.
Examples:
- Sometimes including professional services revenue, sometimes not
- Switching between monthly and annual calculations
- Changing cohort start dates arbitrarily
- Including/excluding certain customer segments inconsistently
Solution: Document your NRR calculation methodology precisely and follow it religiously. Track "as-reported" and "adjusted" if you need to change methodology, showing both calculations for continuity.
Including One-Time Revenue
Problem: NRR should only measure recurring revenue. Including one-time items inflates the metric artificially.
| Do NOT Include | DO Include |
|---|---|
| Implementation or onboarding fees | Monthly or annual subscription fees |
| Professional services engagements | Usage-based recurring charges |
| One-time data migrations | Recurring support or success fees |
| Hardware or perpetual license sales | Recurring consumption revenue |
Solution: Maintain strict separation between recurring and non-recurring revenue in your systems. Many companies track "ARR NRR" (based on ARR only) to avoid confusion.
Not Segmenting by Cohort
Problem: Blended NRR across all customers hides whether you're improving over time.
Example:
- Blended NRR: 110% (looks fine)
- But breakdown:
- 2021 cohort: 125% NRR
- 2022 cohort: 115% NRR
- 2023 cohort: 95% NRR
- Reality: You're getting worse at retention, not better
Solution: Always analyze NRR by cohort to understand trends. If recent cohorts show worse NRR, investigate what changed (product, market, pricing, customer success).
Survivorship Bias
Problem: Only calculating NRR for customers who survived the full period excludes early churners and inflates the metric.
Example:
- Start with 100 customers and $500K MRR
- 20 customers churn in month 1 (representing $80K MRR)
- Remaining 80 customers expand to $480K over 12 months
- Incorrect calculation: $480K / $420K (excluding churned customers from start) = 114% NRR
- Correct calculation: ($420K + expansion - churn) / $500K = lower NRR
Solution: Include ALL customers from the cohort start in your denominator, even those who churned during the period. The churn component captures their lost revenue.
Ignoring the GRR Context
Problem: Reporting NRR without GRR can hide serious retention problems masked by expansion.
Example:
- NRR: 115% (looks strong)
- GRR: 70% (very concerning)
- Reality: You're losing 30% of revenue to churn/contraction and making it up with expansion. Not sustainable.
Solution: Always report NRR and GRR together. If the gap exceeds 30 points, you have a retention problem that needs urgent attention regardless of how good NRR looks.
Mixing New and Existing Customer Revenue
Problem: Accidentally including new customer revenue in NRR calculation makes the metric meaningless.
Example:
- Cohort starts with $500K MRR
- You acquire $200K in new customers during the year
- Ending MRR: $750K
- Incorrect: $750K / $500K = 150% NRR (way too high!)
- Correct: Only count expansion/contraction/churn from original $500K cohort
Solution: Rigorously separate new customer ARR from expansion ARR in your systems. Many companies track "New ARR" and "Expansion ARR" as separate KPIs.
Short Measurement Periods
Problem: Calculating NRR over periods shorter than 12 months creates noise and misses long-term patterns.
Example:
- Monthly NRR might show 102%, but annualized that's 127% (unrealistic)
- Or might show 98%, annualized to 78% (concerning)
- Seasonality, one-time events, and small sample sizes create volatility
Solution: Use 12-month NRR as your standard metric. You can track monthly or quarterly NRR internally for faster feedback, but report annual NRR to investors and for benchmarking.
Conclusion
Net Revenue Retention is the single most important metric for understanding the long-term viability of your SaaS business. It reveals whether you've built a product that naturally expands with your customers or one that requires constant new customer acquisition to offset churn.
Key Takeaways
- Target NRR of 120%+ for venture-scale businesses - This allows meaningful growth from your existing base
- Track both NRR and GRR - GRR reveals core retention health; NRR shows expansion effectiveness
- Analyze by cohort - Cohort trends reveal whether you're improving or regressing over time
- Build expansion into the product - The most efficient expansion happens automatically through usage
- Invest in customer success - Proactive intervention prevents churn and identifies expansion opportunities
- Optimize pricing for expansion - Usage-based components and clear upgrade paths drive higher NRR
- Report transparently to investors - Show trends, cohorts, and component breakdown
The companies that win in SaaS are those with NRR above 120%, demonstrating they've built products so valuable that customers naturally expand their usage over time. Focus relentlessly on improving NRR, and you'll build a business with compounding revenue growth and increasing capital efficiency.
Master NRR, and you've mastered the expansion engine that separates billion-dollar outcomes from lifestyle businesses.