SaaS Quick Ratio: Formula, Calculator, and Benchmarks
Learn how to calculate the SaaS Quick Ratio, understand what good looks like by stage, and discover how VCs use this growth efficiency metric.
If you've ever sat in a board meeting and heard a VC mention "quick ratio," you've witnessed one of the most underrated metrics in SaaS finance. Yet most founders have no idea what it actually means or how to calculate it.
Mamoon Hamid, the legendary partner at Kleiner Perkins (formerly Social Capital), has called the SaaS Quick Ratio his favorite metric for evaluating growth efficiency. It's investor gold—simple enough to calculate, yet profound enough to reveal whether your business is actually scaling efficiently or just burning cash on growth theater.
The problem? Almost no one writes about it. You'll find thousands of articles on CAC, LTV, NRR, and Magic Number. The Quick Ratio gets forgotten. That's a mistake, because it answers a critical question every founder should obsess over: Are we gaining more revenue than we're losing?
In this guide, we'll demystify the SaaS Quick Ratio, show you exactly how to calculate it, and reveal what world-class numbers actually look like.
What is SaaS Quick Ratio?
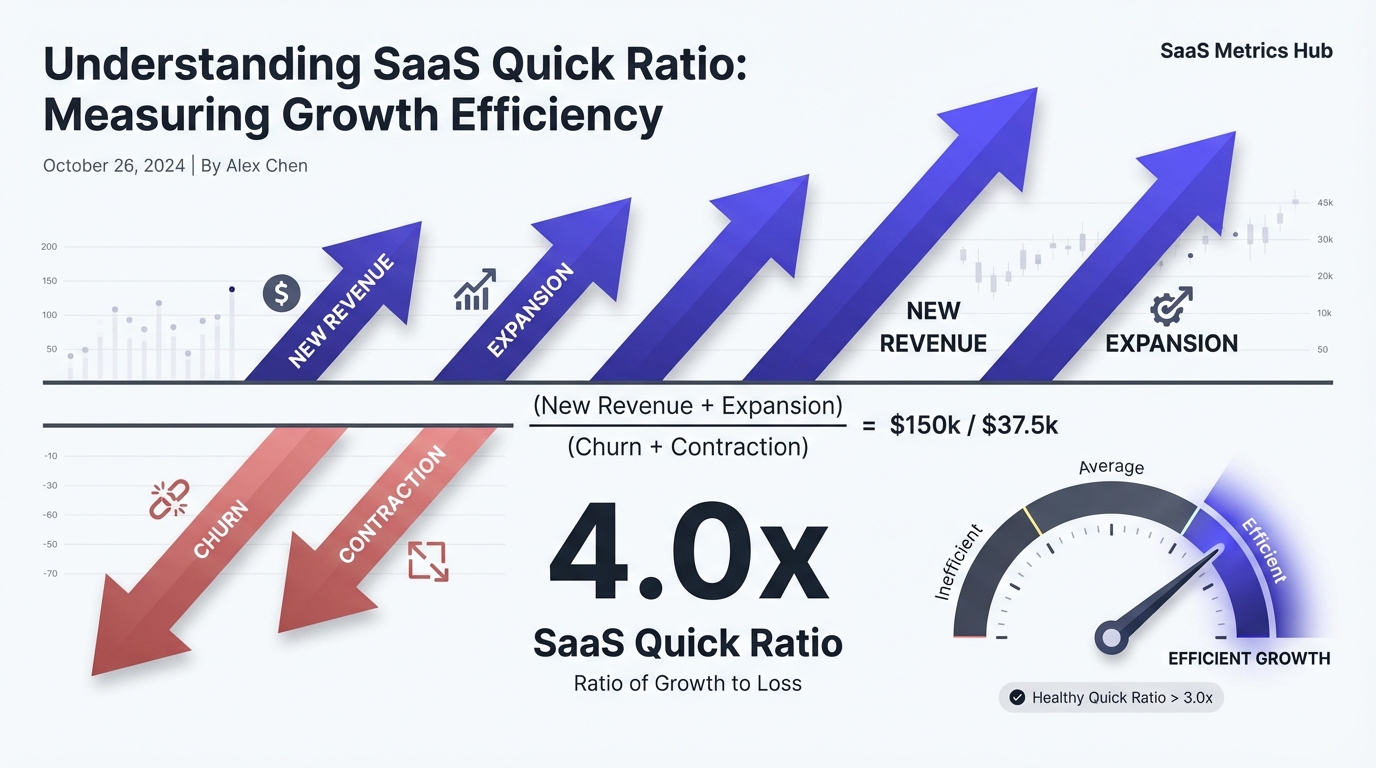
The SaaS Quick Ratio measures how efficiently your business grows by comparing the revenue you're adding against the revenue you're losing. It answers a simple question: For every dollar of growth you lose through churn and contraction, how many dollars are you gaining through new customers and expansion?
Not Your Accounting Teacher's Quick Ratio
First, let's clear up the confusion. You might have learned about Quick Ratio in accounting class—it's a liquidity metric that measures a company's ability to meet short-term obligations. That's completely different from the SaaS Quick Ratio, which is a growth metric.
Important Distinction: Traditional Quick Ratio = (Current Assets - Inventory) / Current Liabilities. SaaS Quick Ratio = Revenue Growth / Revenue Loss. They measure completely different things.
The SaaS Quick Ratio is entirely about efficiency. It's the growth engine check-up for subscription businesses.
Why Investors Love This Metric
VCs obsess over the SaaS Quick Ratio for a simple reason: it reveals sustainability.
A company with 15% month-over-month growth looks impressive. But if that growth comes from massive sales spend ($500K/month CAC) while customers are churning out the back door at 10% per month, the business isn't actually healthy. It's on a treadmill, using borrowed time and borrowed money to look good.
The Quick Ratio cuts through the noise. It shows whether your top-line growth is real—built on a foundation of product-market fit and efficient revenue capture—or illusory, powered by unsustainable marketing spend.
This is why Mamoon Hamid and other sophisticated investors use it as a primary filter. It's less gameable than pure growth metrics, and it directly impacts how much capital you'll need to raise to reach profitability.
The SaaS Quick Ratio Formula
Here's the formula:
Quick Ratio = (New MRR + Expansion MRR) / (Churned MRR + Contraction MRR)Formula Components
| Component | Definition | Example |
|---|---|---|
| New MRR | Monthly recurring revenue from new customers | $75,000 from 60 new customers |
| Expansion MRR | Additional MRR from existing customers who upgraded | $20,000 from upsells and seat expansion |
| Churned MRR | MRR lost when customers cancel | $30,000 from 3 large cancellations |
| Contraction MRR | MRR lost when customers downgrade or reduce usage | $10,000 from 5 downgrades |
New MRR: The monthly recurring revenue from new customers acquired in the period. If you landed a customer with a $5,000/month subscription, that's $5,000 new MRR.
Expansion MRR: Additional MRR gained from existing customers who upgraded, increased seat count, or added features. If your existing customer base added $50,000 in total additional MRR this month, that's your expansion MRR.
Churned MRR: The MRR lost when customers cancel. If you had $100,000 MRR at the start of the month and 10 customers representing $5,000 MRR canceled, that's your churned MRR for the month.
Contraction MRR: The MRR lost when existing customers downgrade or reduce usage. If a customer who was paying $10,000/month drops to $7,000/month, that's $3,000 in contraction MRR.
Worked Example
Let's say you're tracking your MRR components this month:
Revenue Gains:
- New MRR: $75,000 (from 15 new enterprise customers and 45 mid-market deals)
- Expansion MRR: $20,000 (existing customers upgraded plans)
- Total Gains: $95,000
Revenue Losses:
- Churned MRR: $30,000 (three large customers canceled)
- Contraction MRR: $10,000 (five mid-market customers downgraded)
- Total Losses: $40,000
Your Quick Ratio calculation:
Quick Ratio = ($75,000 + $20,000) / ($30,000 + $10,000)
Quick Ratio = $95,000 / $40,000
Quick Ratio = 2.38
This means for every dollar of MRR you lost this month, you gained $2.38. That's solid growth efficiency.
Interpreting Your Quick Ratio
The interpretation scale depends heavily on your stage.
Quick Ratio Ranges
| Quick Ratio | Interpretation | What It Means |
|---|---|---|
| < 1.0 | Emergency | Business is shrinking. Losing more than you're gaining. |
| 1.0-1.5 | Sluggish | Barely keeping up. Acceptable only in recovery mode. |
| 1.5-2.0 | Acceptable | Typical for later-stage companies. Not impressive. |
| 2.0-4.0 | Healthy | Gold zone for growth-stage SaaS. Efficient growth. |
| > 4.0 | Exceptional | Strong product-market fit, minimal churn, excellent expansion. |
What Each Range Means in Practice
Quick Ratio < 1.0: Your business is shrinking. You're losing more revenue than you're gaining. This is an emergency signal—you need to diagnose why (product issues, pricing misalignment, market saturation, or selling to the wrong customers).
Quick Ratio 1.0-1.5: You're barely keeping up. Growth is sluggish and inefficient. You're fighting just to stay flat. This is acceptable only if you're in decline recovery mode or building a mature, profitable business where growth isn't the priority.
Quick Ratio 1.5-2.0: Acceptable growth efficiency, but not impressive. You're adding 50-100% more revenue than you're losing. This is typical for later-stage SaaS companies (Series B/C+) where payback periods have lengthened and growth has naturally slowed.
Quick Ratio 2.0-4.0: Healthy growth efficiency. You're gaining 2-4x more MRR than you're losing. This is the gold zone for most growth-stage SaaS companies. At 3.0, you're adding $3 for every $1 you lose—compelling economics that make efficient growth affordable.
Quick Ratio > 4.0: Exceptional efficiency. You're adding 4+ times more revenue than you're losing. This typically indicates strong product-market fit with minimal churn, excellent expansion, and efficient customer acquisition. This is what investors dream about.
Quick Ratio Benchmarks by Stage
The "good" Quick Ratio number changes as your business matures.
Benchmarks by Stage and Market Segment
| Stage | ARR Range | Target Quick Ratio | Notes |
|---|---|---|---|
| Early Stage | < $500K ARR | 4.0+ | Demonstrates product-market fit; minimal churn |
| Growth Stage | $500K - $10M ARR | 2.0-4.0 | Scaled beyond early adopters; natural churn increases |
| Mature Stage | $10M+ ARR | 1.5-2.5 | Diverse customer base; optimized for unit economics |
Early Stage (Pre-Series A, < $500K ARR)
You need a Quick Ratio of 4.0+ to demonstrate you've found product-market fit. At this stage, you might have minimal churn (because your customer base is small) but lots of variability. A ratio below 3.0 suggests your unit economics aren't compelling enough to justify aggressive growth.
Growth Stage (Series A-B, $500K-$10M ARR)
A Quick Ratio of 2.0-4.0 is healthy. You've scaled beyond early adopters and are hitting more price resistance and churn. Natural churn from market maturation reduces your ratio, but a 2.0+ means your growth is still outpacing your losses at a healthy clip.
Mature Stage (Series C+, $10M+ ARR)
A Quick Ratio of 1.5-2.5 is acceptable. You're a legitimate business with a diverse customer base. Churn is more significant as a percentage of MRR, but you've also optimized for unit economics and profitability. A Quick Ratio of 1.5 with 50% EBITDA margins beats a 3.0 with -10% margins.
By Market Segment
| Segment | Target Quick Ratio | Characteristics |
|---|---|---|
| Enterprise | 1.5-2.0 | Large customers, lower churn but high variance |
| Mid-Market | 2.0-3.0 | Balanced churn/expansion, sales-driven growth |
| SMB/Self-serve | 3.0-5.0 | Higher churn, but strong expansion and efficient acquisition |
Quick Ratio vs. Net Revenue Retention
You'll often see Quick Ratio compared to Net Revenue Retention (NRR), and it's easy to confuse them. They're different angles on the same underlying health.
Key Differences
| Metric | What It Measures | Formula | Focus |
|---|---|---|---|
| Quick Ratio | Growth efficiency (new + expansion vs. churn + contraction) | (New + Expansion) / (Churn + Contraction) | Company-wide growth engine |
| Net Revenue Retention | Existing customer revenue expansion/contraction | (Starting MRR + Expansion - Churn - Contraction) / Starting MRR | Customer-level efficiency |
NRR tells you whether your existing customer base is expanding or contracting as a percentage. An NRR of 120% means your existing customers are worth 20% more month-over-month through expansion and churn.
Quick Ratio tells you how much new customer revenue you're adding relative to what you're losing from your entire base (new, expansion, churn, contraction).
Think of it this way: NRR is about customer-level efficiency. Quick Ratio is about growth efficiency.
Example Scenarios
Scenario A: High NRR, Low Quick Ratio
- NRR: 150% (incredible expansion)
- Quick Ratio: 1.0 (barely growing)
- Diagnosis: Losing customers at such a high rate that new customer acquisition barely offsets the losses
Scenario B: Low NRR, High Quick Ratio
- NRR: 80% (minor downgrades)
- Quick Ratio: 4.0 (strong growth)
- Diagnosis: Low-touch, efficient new customer acquisition that more than compensates for minor downgrades
For investor discussions, Quick Ratio often matters more because it directly drives growth rate. For operational diagnostics, NRR tells you whether your retention motion is working.
How to Improve Your Quick Ratio
Improving your Quick Ratio means either growing the numerator (new and expansion MRR) or shrinking the denominator (churn and contraction).
Grow the Numerator
Increase New MRR
Tactics:
- Better product differentiation and clearer value propositions
- Improved marketing efficiency and channel optimization
- More efficient sales processes and better conversion rates
- Enter higher-value market segments with better retention profiles
If your new MRR is weak, the problem is product-market fit, go-to-market efficiency, or both.
Increase Expansion MRR
This is the expansion revenue play. Focus on strategies that make customers naturally grow their spending over time.
Tactics:
- Faster onboarding: Customers who experience value faster are more likely to expand
- Built-in expansion hooks: Usage-based pricing, seat-based models, feature tiers
- Natural upgrade paths: Clear progression from starter to growth to enterprise tiers
- Proactive customer success: Regular check-ins to identify expansion opportunities
Shrink the Denominator
Reduce Churn
Churn is the hardest factor to move quickly. It requires long-term product investment and customer success systems.
Tactics:
- Early warning signals: Monitor product engagement metrics, support ticket sentiment, usage trends
- Proactive intervention: Reach out before customers leave, not after
- Better onboarding: Most churn happens in the first 90 days; nail this period
- Regular value realization: Ensure customers continuously see ROI from your product
Reduce Contraction
Downgrades often precede churn. If customers are downgrading, it signals dissatisfaction with their current tier.
Tactics:
- Better onboarding: Ensure customers understand and use premium features
- Feature education: Targeted campaigns about high-value features they're not using
- Price repositioning: Sometimes pricing tiers don't align with customer value perception
- Usage analysis: Understand why customers downgrade and address the root cause
The Compounding Effect
Here's what's beautiful about the Quick Ratio: small improvements compound dramatically.
Example: If you improve new MRR by 20% and reduce churn by 10%, you don't just get a 30% improvement—you get a multiplicative gain.
Let's look at our earlier example (Quick Ratio 2.38):
Baseline:
- New MRR: $75,000
- Expansion MRR: $20,000
- Churned MRR: $30,000
- Contraction MRR: $10,000
- Quick Ratio: 2.38
After Improvements:
- Increase new MRR from $75K to $90K (+20%)
- Reduce churned MRR from $30K to $27K (-10%)
- Keep expansion and contraction flat
New Quick Ratio = ($90,000 + $20,000) / ($27,000 + $10,000)
New Quick Ratio = $110,000 / $37,000
New Quick Ratio = 2.97
You've jumped from 2.38 to 2.97—a 25% improvement—with modest changes to the numerator and denominator. That's the power of compound efficiency.
Quick Ratio Limitations
The Quick Ratio is powerful, but it's not a complete picture. Here's what it misses:
Doesn't Show Absolute Growth
A business with a 4.0 Quick Ratio might be adding $1,000 MRR per month. A business with a 1.5 Quick Ratio might be adding $100,000 MRR per month. The Quick Ratio alone doesn't distinguish between these scenarios. Context matters.
Can Be Temporarily Gamed
A company can artificially boost its Quick Ratio by slashing prices on new customer acquisition (increase new MRR temporarily), but this doesn't create sustainable value. That's why investors look at Quick Ratio trends over quarters, not single-month snapshots.
Needs Context on Timing
If you're early in a new product launch, you might have high churn and contraction while you iterate toward product-market fit. Your Quick Ratio might be 0.5, but that doesn't mean your business is broken—it means you're in an expected phase.
Doesn't Incorporate CAC and Unit Economics
A Quick Ratio of 3.0 built on $500,000 CAC for self-serve customers is very different from 3.0 built on $30,000 CAC. You need to understand how you're acquiring that new MRR.
Using Quick Ratio in Investor Conversations
When you're in a board meeting or investor meeting, here's how to present your Quick Ratio strategically:
Best Practices for Reporting
1. Show the trend: One month of 1.5 Quick Ratio is noise. Six months of 1.5 trending toward 2.0 is a narrative: "We've improved growth efficiency by improving onboarding and retention."
2. Benchmark against your stage and segment: Don't compare your Series B SaaS company to a pre-seed company. Context matters.
3. Correlate with other metrics: Show how Quick Ratio connects to your growth rate, unit economics, CAC payback, and path to profitability. "Our 2.5 Quick Ratio is driving 15% MoM growth with a CAC payback of 14 months."
4. Explain the drivers: Break down what's improving: "Our Quick Ratio improved from 1.8 to 2.2 primarily because we reduced churn from 5% to 3.5% through better onboarding, while keeping CAC flat."
Sample Investor Narrative
"Our Quick Ratio has improved from 1.8 in Q1 to 2.4 in Q4, driven by two key initiatives: We reduced gross churn from 4.2% to 2.8% through a redesigned onboarding flow, and we increased expansion revenue by 35% through our new enterprise tier. This improvement means we're now generating $2.40 in new and expansion MRR for every $1.00 we lose to churn and contraction. Combined with our CAC payback of 16 months, we're on track to reach Rule of 40 by end of next year."
Action Checklist
Ready to leverage the Quick Ratio? Follow these steps:
- [ ] Calculate your Quick Ratio for the last 6 months
- [ ] Break down components: New MRR, Expansion MRR, Churned MRR, Contraction MRR
- [ ] Plot the trend: is your ratio improving or declining?
- [ ] Compare against stage-appropriate benchmarks
- [ ] Identify your biggest lever for improvement (new, expansion, churn, or contraction)
- [ ] Set a quarterly target and create an action plan
- [ ] Track Quick Ratio monthly alongside NRR and growth rate
Conclusion
The SaaS Quick Ratio is the efficiency metric your investors are already calculating, whether you share it explicitly or not. It cuts through growth theater and shows whether your business is building on a sustainable foundation or running on a high-spend, high-churn treadmill.
A Quick Ratio of 2.0+ means every dollar you spend acquiring and retaining customers is being multiplied by revenue from your existing base. That's the foundation of a business that can eventually be profitable without endless capital raises.
Track it monthly, understand the drivers behind it, and focus relentlessly on improving it. That's what world-class SaaS companies do.