LTV:CAC Ratio Optimization: A Practical Guide to SaaS Unit Economics
Master the LTV to CAC ratio with this complete guide covering calculation methods, industry benchmarks, and proven tactics to improve your SaaS unit economics.
LTV:CAC Ratio Optimization: A Practical Guide
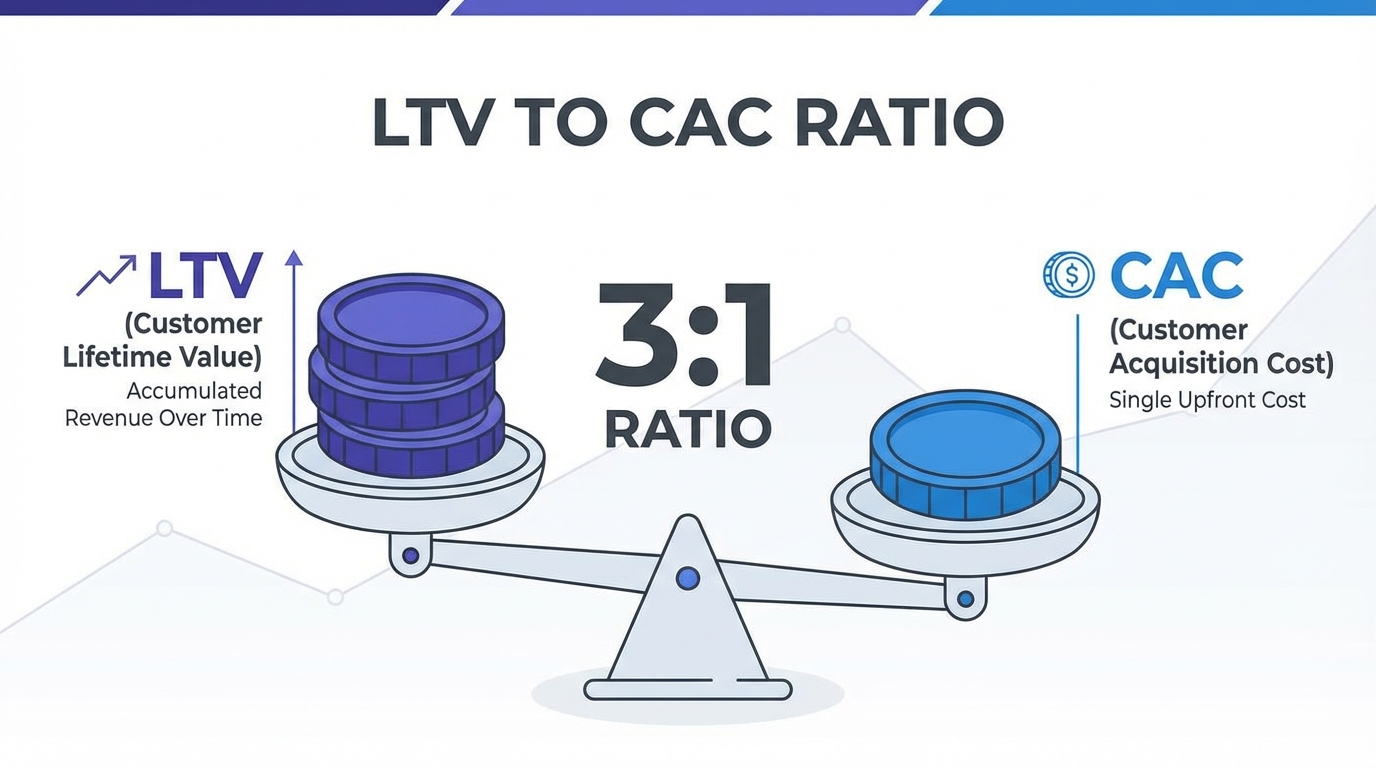
You've probably heard the rule: your LTV to CAC ratio should be at least 3:1. It's one of the first metrics every SaaS founder learns. But here's the uncomfortable truth: that rule is incomplete.
A 3:1 ratio might mean you're leaving growth on the table. Or it might mean you're burning through cash faster than your business can sustain. The same 3:1 ratio could be a home run for one company and a red flag for another.
The real power of LTV:CAC isn't in hitting a magic number—it's in understanding what the ratio reveals about your unit economics and knowing exactly where to pull the levers to improve it. This guide walks you through the calculations, the benchmarks that actually matter for your business, and the specific tactics that will move your ratio in the right direction.
The LTV:CAC Refresher
Let's start with the basics, because getting these definitions right is non-negotiable.
Customer Lifetime Value (LTV)
LTV is the total profit your company expects to make from a customer over the lifetime of their relationship with you.
Simple LTV Formula:
LTV = (ARPU × Gross Margin × Customer Lifespan in Months)Or more directly:
LTV = (ARPU × Gross Margin) / Churn RateKey Components
| Component | Definition | Example |
|---|---|---|
| ARPU | Average Revenue Per User (monthly or annual) | $500/month per customer |
| Gross Margin | (Revenue - COGS) / Revenue | 80% (keeps $80 of every $100) |
| Customer Lifespan | 1 / Monthly Churn Rate | 5% churn = 20 months average |
Customer Acquisition Cost (CAC)
CAC is the fully-loaded cost to acquire a single customer.
CAC Formula:
CAC = (Total Sales & Marketing Spend) / (New Customers Acquired in Period)This must include:
- Salesperson salary (fully loaded with benefits and overhead)
- Marketing team salary and costs
- Advertising spend and tools
- Marketing automation platforms
- CRM software
- Sales tools and enablement
Critical point: CAC is often understated because teams forget the "fully loaded" part. A $50k/year salesperson's acquisition cost isn't just the commission you paid—it's their full salary, benefits, equipment, and a proportional share of management overhead.
The Ratio Explained
LTV:CAC Ratio = LTV / CACThis ratio tells you: for every dollar you spend acquiring a customer, how many dollars in profit do you get back?
A 3:1 ratio means: spend $1 to acquire a customer worth $3 in lifetime profit. A 5:1 ratio means $1 spent yields $5 in profit.
Simple, right? Except it's not, because the "right" ratio depends entirely on your business model.
The 3:1 Rule (And When It's Wrong)
The 3:1 LTV:CAC benchmark has become gospel in SaaS. But where did it come from, and when does it actually apply?
The Origin of 3:1
The 3:1 rule emerged from venture capital-backed SaaS companies in the 2010s. For a business burning cash and racing to scale, 3:1 was the minimum threshold that made venture math work:
- Spend aggressively on sales and marketing (up to CAC)
- Recoup that investment within reasonable payback periods
- Still have room for operating expenses and profit
It became a shorthand. If you're below 3:1, you're spending too much on acquisition. If you're above 3:1, you might not be spending enough on growth.
But this rule was built for a specific context: high-growth venture-backed companies. It's not universal.
When 3:1 Is Actually the Right Target
The 3:1 ratio makes sense for:
- Venture-backed companies racing to market dominance
- High-burn, high-growth businesses where growth rate matters more than profitability
- Businesses with low gross margins (15-30%), where 3:1 barely covers operating costs and profit
- Sales-driven businesses with 2-3 month CAC payback periods
When Higher Than 3:1 Is Better (You're Underinvesting)
If your LTV:CAC is 10:1 or higher, you might actually be leaving money on the table.
Example: Your LTV is $50,000. Your CAC is $3,000. That's a 16:1 ratio. You could double your marketing spend, bring CAC to $6,000, acquire twice as many customers, and still have a healthy 8:1 ratio. You're leaving growth on the table.
This is especially true if:
- You have a gross margin above 70% (you can afford to spend more on acquisition)
- Your payback period is under 6 months (you recoup your acquisition investment quickly)
- Your market is expanding and you have runway to invest in growth
When Lower Than 3:1 Is Acceptable (Land and Expand)
Some businesses intentionally run 2:1 or even 1.5:1 LTV:CAC ratios because they have a multi-step revenue model:
- Land cheaply with a low-touch self-serve product
- Expand revenue through upsells, cross-sells, and usage-based growth
- Mature relationships with multiple revenue streams
Examples: Slack landed as a $12/month product but expanded through channels and integrations. Figma's initial CAC is low relative to initial ARPU, but expansion revenue is substantial.
In these cases, initial LTV:CAC might be 1.5:1, but the long-term LTV:CAC (including expansion) is 8:1+. The key is that the expansion revenue is predictable and engineered into the product.
Warning: If your LTV:CAC is below 2:1, you have a real problem. You're not generating enough lifetime value to cover customer acquisition, let alone operating expenses or profit. This is unsustainable except as a short-term expansion play in an established market.
Calculating LTV:CAC Properly
The formula is simple. The execution is where most companies stumble.
LTV Calculation: Three Approaches
Method 1: Cohort Average (Recommended)
Take a cohort of customers acquired in the same period, track their actual revenue over time, calculate average:
Cohort LTV = Average Revenue per Customer × Average Lifespan × Gross MarginThis is the most accurate because it uses real data, not assumptions.
Method 2: Blended Calculation (For Annual Reporting)
LTV = (Annual Recurring Revenue × Gross Margin) / Annual Churn RateUse actual company-wide ARR and churn rate. This gives you blended LTV across all customers.
Method 3: Micro-Level (By Segment)
Calculate LTV separately for each customer segment because they have different lifespans:
| Segment | ARPU | Gross Margin | Annual Churn | LTV |
|---|---|---|---|---|
| Enterprise | $500k | 85% | 5% | $8.5M |
| Mid-Market | $50k | 80% | 15% | $267k |
| SMB | $5k | 75% | 30% | $12.5k |
CAC Calculation: The Fully Loaded Approach
This is where most companies go wrong. Let's work through it:
Example Company: $10M ARR SaaS, 100 new customers per year
| Cost Category | Annual Amount |
|---|---|
| Direct marketing spend | $300,000 |
| Sales team salary (3 people × $100k) | $300,000 |
| Sales tools, CRM, platforms | $50,000 |
| Marketing team salary (2 people × $80k) | $160,000 |
| Marketing platform costs | $40,000 |
| Allocated overhead (20% × $200k) | $40,000 |
| Total Annual Sales & Marketing | $890,000 |
CAC = $890,000 / 100 customers = $8,900 per customerThis is a true, fully loaded CAC. Now a 5:1 LTV:CAC ratio means $44,500 average LTV per customer.
Common Calculation Mistakes
1. Blended CAC Across Segments with Different Acquisition Costs
Problem: Enterprise sales cost $50k each. Product-led growth costs $1k each. Blending them masks that PLG is massively efficient and direct sales is struggling.
Fix: Calculate separately, report separately.
2. Ignoring Payback Period
Problem: LTV:CAC ratio alone doesn't tell you when you break even on acquisition spend. A 5:1 ratio with a 24-month payback is riskier than a 3:1 ratio with a 6-month payback.
Fix: Always report both metrics together.
3. Using Growth Rate Instead of CAC
Problem: A common mistake in fast-growing companies: "We acquired 500 customers for $1M marketing spend, so CAC is $2,000." This ignores the fixed cost of your sales team, product management overhead, etc.
Fix: Use fully loaded CAC that includes all sales and marketing costs.
4. Inconsistent Gross Margin Assumptions
Problem: CAC should use the customer's actual gross margin, not blended company gross margin. Enterprise customers might have 85% margins while SMB customers have 65%.
Fix: Use segment-specific margins.
LTV:CAC Benchmarks by Context
There's no universal "right" LTV:CAC ratio. It depends on your situation.
By Company Stage
| Stage | LTV:CAC Range | Why |
|---|---|---|
| Seed/Pre-PMF | 1:1 to 2:1 | Still proving value; high CAC, unproven LTV |
| Series A (Growth) | 2:1 to 4:1 | Optimizing for scale; accept lower ratio for growth |
| Series B+ (Efficiency) | 3:1 to 8:1 | Profitability matters; improve LTV or reduce CAC |
| Public/Mature | 5:1 to 10:1+ | Growth is slower; focus on margin and retention |
By Go-to-Market Motion
| GTM Model | LTV:CAC Range | Why |
|---|---|---|
| Product-Led Growth (PLG) | 5:1 to 15:1 | Low CAC, high LTV, higher churn |
| Self-Serve + Sales | 3:1 to 6:1 | Blended acquisition cost; segment-dependent |
| Enterprise Sales | 2:1 to 5:1 | High CAC per customer; depends on deal size |
| Marketplace | 1:1 to 4:1 | Highly dependent on supply-side CAC |
By Customer Segment
| Segment | LTV:CAC Range | Context |
|---|---|---|
| Enterprise (>$100k ARR) | 3:1 to 8:1 | High LTV, high CAC, low churn = good ratio |
| Mid-Market ($10-100k ARR) | 2:1 to 5:1 | Balanced; improving margins is key |
| SMB (<$10k ARR) | 1.5:1 to 3:1 | Low LTV; must keep CAC tight through PLG |
By Funding Environment
| Environment | LTV:CAC Expectation |
|---|---|
| Bull market (growth era) | 2:1 to 4:1 acceptable; focus on growth rate |
| Bear market (efficiency era) | 4:1 to 6:1 expected; focus on profitability |
| Public markets | 5:1+ expected; proven unit economics mandatory |
Key insight: Adjust your benchmark based on your stage, GTM, and customer type. Don't benchmark against an enterprise sales company if you're PLG.
Diagnosing LTV:CAC Problems
Your ratio is "too low." Now what? The diagnostic process matters more than the number itself.
If Your Ratio Is Too Low (Below 2:1)
Question 1: Is your LTV understated or your CAC overstated?
Run these checks:
- LTV: Are you using the most recent cohort? Have these customers been with you long enough to demonstrate their real lifespan? New products often show artificially low LTV until you have 12+ months of retention data.
- CAC: Are you double-counting costs? Some companies allocate marketing spend to both CAC and as a separate P&L line item.
Question 2: Is the ratio low for your whole company or specific segments?
- If it's just SMB, you might need to reduce SMB CAC through PLG or stop focusing on SMB.
- If it's just a new channel, you might be in early-stage optimization and expecting improvement.
- If it's company-wide, you have a fundamental unit economics problem.
Question 3: What's your payback period?
- If payback is 3 months and ratio is 2:1, you're reinvesting efficiently and this might be acceptable.
- If payback is 24 months and ratio is 2:1, you have a cash flow problem—your CAC is too high.
If Your Ratio Is Too High (Above 10:1)
Question 1: Are you underinvesting in growth?
Check:
- What's your market share? Can you grow it?
- What's your payback period? If it's under 6 months, you could double marketing spend.
- Are competitors investing more aggressively? You might be leaving share on the table.
Question 2: Are you optimizing for the wrong metric?
Some companies deliberately optimize for profitability over growth and accept high LTV:CAC. This is valid, but make sure it's intentional, not accidental.
Question 3: Is your LTV overstated?
High LTV:CAC often means high churn assumption going unexamined. If your actual churn exceeds your LTV calculation, your ratio will collapse. Run quarterly LTV reforecasts to stress-test your assumptions.
Improving LTV (The Numerator)
To improve your ratio, pull the levers that increase lifetime value.
Reduce Churn
1% reduction in annual churn = 5-7% improvement in LTV. This is the highest-leverage move.
Tactical Playbook
- [ ] Implement customer health scoring - Identify at-risk customers before they churn
- [ ] Improve onboarding - Customers who hit value faster churn less. Cut time-to-first-win
- [ ] Build retention features - Add features that increase switching costs (integrations, automation, native workflows)
- [ ] Create renewal discipline - Proactive renewal conversations 60 days before expiration prevent surprises
Increase Expansion Revenue
Upsells and cross-sells directly increase LTV without adding CAC.
Expansion Strategies
Usage-based pricing: Charge for actual value delivered. Customers who get more value pay more.
Segment-based licensing: Offer paid tiers that unlock additional features (advanced analytics, API access, higher limits).
Professional services: High-margin offerings that deepen customer relationships and increase switching costs.
Partner ecosystem: Expand revenue through integrations and add-ons customers willingly pay for.
Example: Slack's initial ARPU was $15/month. Through expansion (more teams, deeper features, enterprise add-ons), blended ARPU grew to $45+/month while maintaining similar churn. That's a 3x LTV increase without changing CAC.
Improve Gross Margin
Reducing cost of goods sold increases the percentage of revenue that goes toward covering CAC and operating expenses.
Margin Improvement Tactics
Reduce infrastructure costs: Optimize database queries, cache more, negotiate bandwidth deals.
Automate support: Self-serve docs, chatbots, and community reduce per-customer support costs.
Negotiate vendor contracts: Commit volumes, negotiate seats, renegotiate annually.
A 5% gross margin improvement = 5-10% LTV improvement depending on your model.
Pricing Optimization
Increase ARPU without losing customers.
Value-based pricing: Charge what customers can afford to pay, not what it costs you to deliver.
Annual discounts: Move customers to annual contracts. Higher ARPU, predictable revenue.
Minimum pricing: Cap the discount for self-serve. Many companies leave 20-30% of potential revenue on the table by over-discounting.
Improving CAC (The Denominator)
Pull these levers to reduce the cost of acquiring customers.
Channel Optimization
Not all acquisition channels are equal. Find the efficient ones and double down.
Channel Analysis Framework
| Channel | Typical CAC | Best For |
|---|---|---|
| Product-Led Growth | 50-70% lower than sales | Self-serve SaaS, developer tools |
| Referral Programs | 30-50% lower than paid | Companies with happy, engaged customers |
| Content Marketing | Declining CAC over time | Long-term play, builds compound value |
| Paid Ads | Baseline CAC | Scalable but expensive |
Shift budget from expensive channels (paid ads at $20 CAC) to efficient channels (referrals at $5 CAC).
Conversion Rate Improvements
Small conversion improvements compound into major CAC reductions.
Sales process efficiency: Better qualifying, shorter sales cycles, higher close rates = lower CAC per closed customer.
Product onboarding: If 40% of free trial users become paying (versus 20% last year), your effective CAC per activated customer drops 50%.
Reduce friction: Eliminate steps, approvals, or discovery calls that slow down buying decisions.
Product-Led Growth
PLG is the most efficient growth channel for most SaaS companies.
Free trial or freemium: Let users try before buying. The cost per trial user is near zero; you only pay for activation.
Virality: Build features that cause customers to invite others (shared documents, collaboration, integrations).
Community: A strong user community becomes your free marketing channel.
PLG CAC is often 1/3 to 1/10 the cost of sales-driven CAC because you remove the sales team salary from the equation.
Brand and Word-of-Mouth
At scale, brand and word-of-mouth dramatically reduce CAC.
Case studies and proof: Reduce buying risk for prospects; they close faster.
Brand consistency: Be everywhere customers look. Industry events, podcasts, publications, social media. Brand reduces effective CAC because customers self-select.
Community building: Stripe's developer community, Figma's design community—these reduce CAC because customers do the marketing for you.
LTV:CAC in Practice
Knowing the calculation is one thing. Using it strategically is another.
How Often to Calculate
| Frequency | Purpose |
|---|---|
| Monthly | Track blended company LTV:CAC as a board metric |
| Quarterly | Deep-dive into segment-specific ratios and cohort analysis |
| Annually | Full audit including payback period, gross margin validation, and cohort-level LTV forecasting |
Cohort Analysis Approach
Your best tool is cohort analysis. Compare customers acquired in the same month across multiple years:
| Cohort | Month 1-12 Revenue | Month 13-24 Revenue | LTV (24-month) | CAC | Ratio |
|---|---|---|---|---|---|
| Jan 2023 | $40k | $55k | $71k (w/ 75% margin) | $12k | 5.9:1 |
| Jan 2024 | $35k | TBD | (Forecasted) | $13k | TBD |
| Jan 2025 | $30k | TBD | (Forecasted) | $15k | TBD |
This reveals trends: Is LTV trending down (churn increasing or expansion slowing)? Is CAC trending up (market saturation, channel exhaustion)?
Setting Targets by Segment
Don't set a single company-wide LTV:CAC target. Set segment-specific targets:
- Enterprise: 4:1 minimum (high LTV, can tolerate higher CAC)
- Mid-Market: 3:1 minimum (balanced segment)
- SMB/PLG: 5:1 minimum (low LTV, must keep CAC tight)
This forces focus on the root causes: Enterprise might need better retention, SMB might need to shift to PLG.
Reporting to Investors
Investors want to see:
- Blended company LTV:CAC (headline number)
- Segment breakdown (shows portfolio health)
- Cohort trend (shows whether unit economics are improving)
- CAC payback period (shows cash flow health)
- Path to improvement (shows you understand what to optimize)
Include this in board materials. Many founders only report revenue growth, missing the chance to prove unit economics are sound.
Common Mistakes to Avoid
Mistake 1: Blending Metrics Across Segments
Problem: A company with 80% enterprise (4:1 LTV:CAC) and 20% SMB (2:1 LTV:CAC) blends to 3.6:1. But this masks that SMB is unsustainable.
Fix: Calculate and report segment-specific ratios. Manage them separately.
Mistake 2: Ignoring Payback Period
Problem: A 5:1 ratio with 24-month payback is less impressive than a 3:1 ratio with 6-month payback.
Fix: Always report both. Payback period drives cash flow; ratio drives profitability.
Mistake 3: Over-Optimizing Ratio vs Absolute Growth
Problem: Some founders hit their LTV:CAC target by cutting CAC (reducing marketing) rather than improving LTV. This tanks absolute growth.
Fix: Optimize the ratio AND grow the denominator. You want to acquire more customers efficiently, not fewer customers profitably.
Mistake 4: Inconsistent Calculation
Problem: Calculating LTV one month using 24-month lookback, next month using 36-month lookback. This creates false trends.
Fix: Define your calculation methodology once. Document it. Implement it systematically.
Mistake 5: Not Accounting for Cohort Changes
Problem: Last year's cohorts had 2-year lifespans. This year's customers are churning faster due to market change. Your overall LTV:CAC appears to decline, but it's not because acquisition worsened—it's because retention worsened.
Fix: Separate retention trends from acquisition trends. Use cohort analysis to isolate each factor.
Quick Reference: LTV:CAC Optimization
Target Ratios by Context
| Context | Target Ratio |
|---|---|
| Seed Stage | 1:1 - 2:1 |
| Series A | 2:1 - 4:1 |
| Series B+ | 3:1 - 8:1 |
| Public/Mature | 5:1 - 10:1+ |
Improvement Levers
To Increase LTV:
- Reduce churn (highest impact)
- Increase expansion revenue
- Improve gross margin
- Optimize pricing
To Decrease CAC:
- Channel optimization
- Conversion rate improvements
- Product-led growth
- Brand and word-of-mouth
Conclusion
The 3:1 LTV:CAC ratio is a starting point, not a target. Your ratio should be tailored to your stage, GTM model, and customer segment.
The real power of LTV:CAC is diagnostic. It tells you whether your unit economics work. Improving it requires understanding which lever to pull: reduce churn, increase expansion, improve CAC, or adjust your target based on your business model.
Start by calculating it accurately (fully loaded CAC, realistic LTV based on actual cohort data). Then track it monthly, analyze it quarterly, and use it to focus your entire go-to-market strategy.
The companies that win don't just hit an arbitrary ratio—they understand the drivers of that ratio and optimize them with laser focus.
Related Reading: